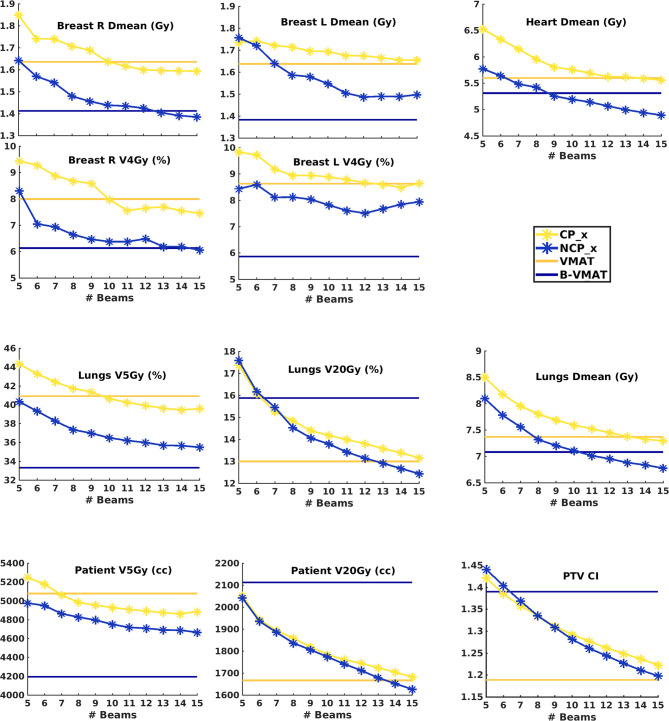
Figure 2.
Population mean dosimetric plan parameters for CP_x and NCP_x as a function of the number of beams per plan (x). The dashed horizontal lines indicate the population mean values for VMAT and B-VMAT. p-Values for beam configuration comparisons are presented in Figure B2 in Electronic Supplement B .

