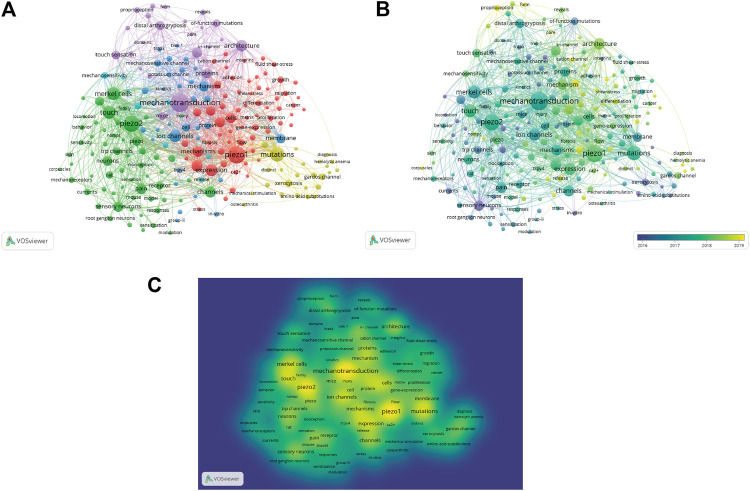
FIGURE 8.
Co-occurrence analysis of keywords. (A) Mapping of keywords of studies. (B) Distribution of keywords according to average publication year (blue: earlier, yellow: later). (C) Distribution of keywords according to the mean frequency of appearance. Keywords in yellow occurred with the highest frequency.

