Figure 3.
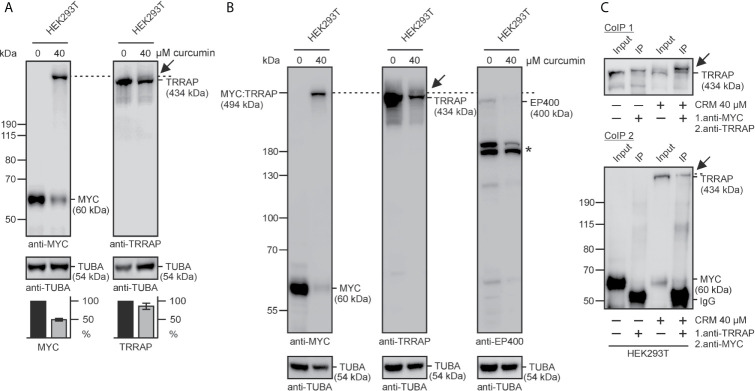
Identification of the TRRAP coactivator interacting with MYC. (A) HEK293T cells were grown for 24 h in the presence of curcumin, and cell extracts prepared and analyzed by immunoblotting. Left panel: besides endogenous MYC with an apparent M r = 60,000, a protein band with an apparent M r of ~500,000 is detectable under curcumin using a MYC-specific antibody (anti-MYC). Right panel: in the presence of curcumin, the TRRAP-specific antibody (anti-TRAPP) recognizes an additional TRRAP-specific protein migrating above the expected 434-kDa TRRAP protein (arrow). As a loading control, α-tubulin (TUBA) expression was analyzed. Lower panels: relative protein levels of MYC and TRRAP, quantified using the program ImageQuant. (B) HEK293T cells were treated with curcumin, and analyzed as under (A) using antibodies directed against MYC, TRRAP, EP400, and α-tubulin. The dashed lines in (A, B) depict the gel migration position of the MYC : TRRAP adduct migrating above the faint EP400-specific band in the presence of curcumin. The star (*) indicates the position of EP400 degradation products. (C) Co-immunoprecipitation analysis using extracts from HEK293T cells treated with or without curcumin and MYC-specific (CoIP 1), or TRRAP-specific (CoIP 2) antibodies (anti-MYC, anti-TRRAP) for the first precipitation under native conditions, and anti-TRRAP (CoIP 1), or anti-MYC (CoIP 2) for the immunological detection after protein blotting, respectively (CoIP 1: due to uneven gel electrophoresis the two input bands migrated slightly faster than the corresponding IP bands). Precipitated proteins were dissociated, and analyzed by SDS-PAGE and immunoblotting using anti-TRRAP or anti-MYC, respectively. As a reference 1% of the lysates were used as input controls. Representative experiments (n = 2) are shown.

