FIGURE 1.
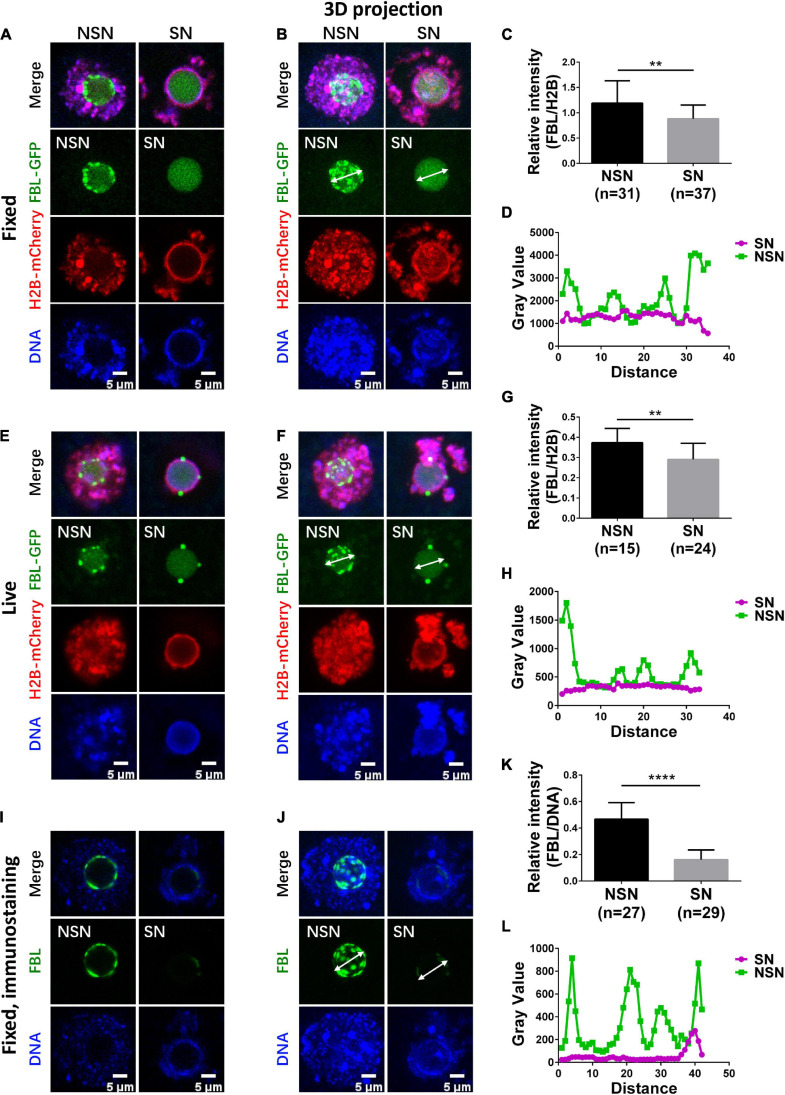
Organization of FBL clusters in NSN and SN oocytes. (A,B) FBL exhibits a clustered distribution pattern in fixed NSN GV oocytes. The clusters decrease significantly in fixed SN GV oocytes. Representative z section (A) and 3D projection (B) confocal images of exogenously expressed FBL–GFP and H2B-mCherry in oocytes are shown. Scale bar = 5 μm. (C) Bar graph shows relative FBL signal intensity to H2B signal intensity in fixed NSN and SN GV oocytes. N = 68. **P < 0.01. (D) The intensity distribution of FBL was measured along the arrow lines drawn on the images in (B). Green, NSN; purple, SN. (E,F) FBL distribution patterns in live NSN and SN GV oocytes. Representative z section (E) and 3D projection (F) confocal images of exogenously expressed FBL–GFP and H2B-mCherry in oocytes are shown. Scale bar = 5 μm. (G) The bar graph shows relative FBL signal intensity to H2B signal intensity in live NSN and SN GV oocytes. N = 39. **P < 0.01. (H) The intensity distribution of FBL was measured along the arrow lines drawn on the images in (F). Green, NSN; purple, SN. (I,J) FBL distribution patterns were confirmed with anti-FBL in fixed NSN and SN oocytes. Representative z section (I) and 3D projection (J) confocal images of endogenous FBL localization are shown. Scale bar = 5 μm. (K) The bar graph shows relative anti-FBL signal intensity to DNA signal intensity in fixed NSN and SN GV oocytes. N = 56. ****P < 0.0001. (L) The intensity distribution of anti-FBL was measured along the arrow lines drawn on the images in (J). Green, NSN; purple, SN.

