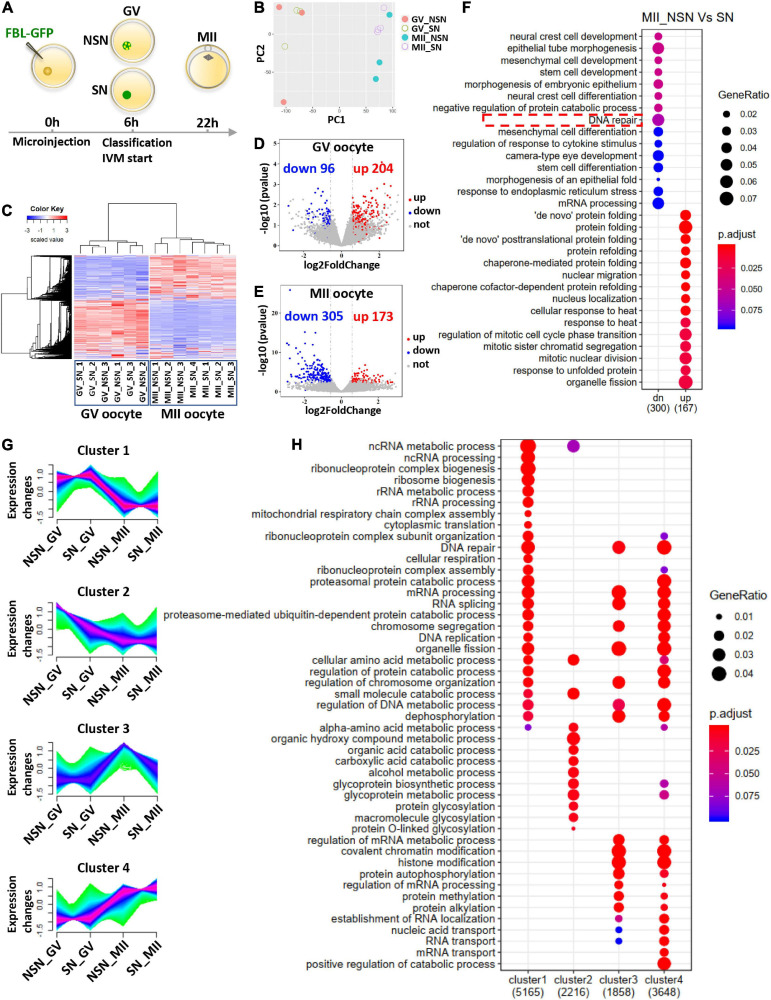
FIGURE 3.
Transcriptome comparison before and after meiotic maturation of NSN and SN oocytes. (A) Schematic illustrating the pipeline of preparing single oocyte RNA-Seq samples. (B) PCA analysis of RNA-Seq data from NSN and SN oocytes at the GV and MII stages. Each dot represents one library, color-coded by oocyte type and stage. (C) Gene expression heatmap of NSN and SN oocytes at the GV stage and MII stage. The blue to red color change represents the transcription level from low to high. (D,E) Volcano plot of DEGs in NSN oocytes vs. SN oocytes at the GV stage and MII stage. The upregulated (fold change >1.5) and downregulated (fold change <–1.5) transcripts in each comparison are labeled by red and blue, respectively (P < 0.05). (F) Gene ontology analysis of the upregulated and downregulated DEGs between NSN and SN MII oocytes. (G) Mfuzz analysis of RNA-Seq data from NSN and SN oocytes at the GV and MII stages. The x axis represents oocyte types and stages, while the y axis represents standardized FPKM. Green to purple colored lines correspond to genes with low to high membership value. (H) Gene ontology analysis of genes in the four clusters from (G) (see also Supplementary Tables 1–3).

