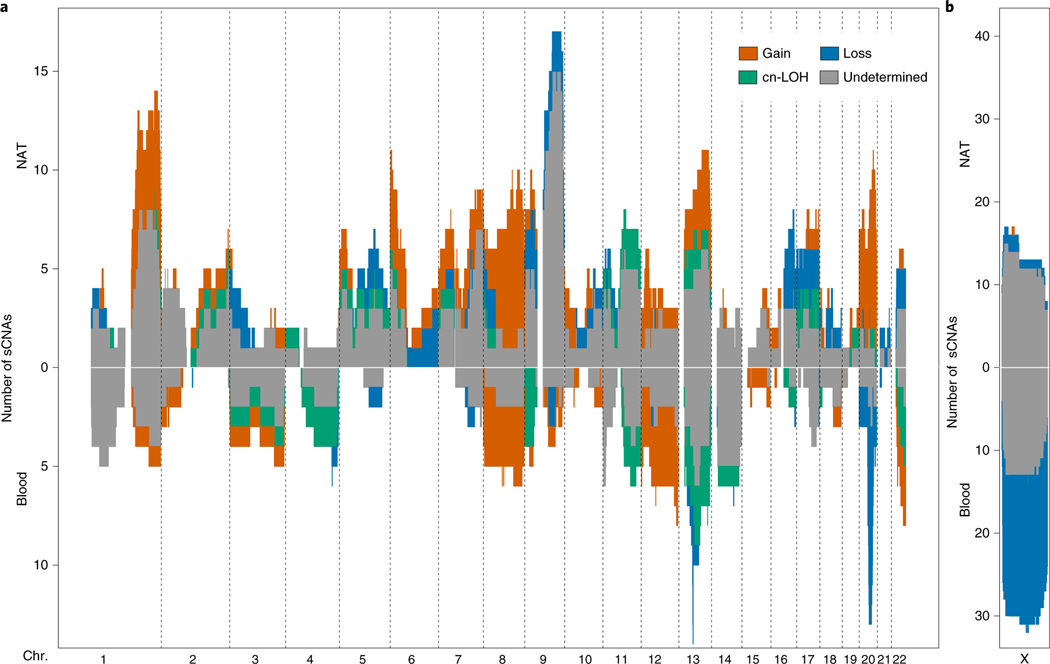
Fig. 3 |. Landscape of sCNAs.
a, The landscape of autosomal sCNAs across blood and NAT tissues. Chromosomes are ordered along the x axis and sCNAs were binned in 1-Mb genomic segments on the basis of their overlap with that region. The number of sCNAs (y axis) is plotted using a different color for each event type. b, The landscape of chromosome X sCNAs in female blood and NAT tissues.

