
FIGURE 3.
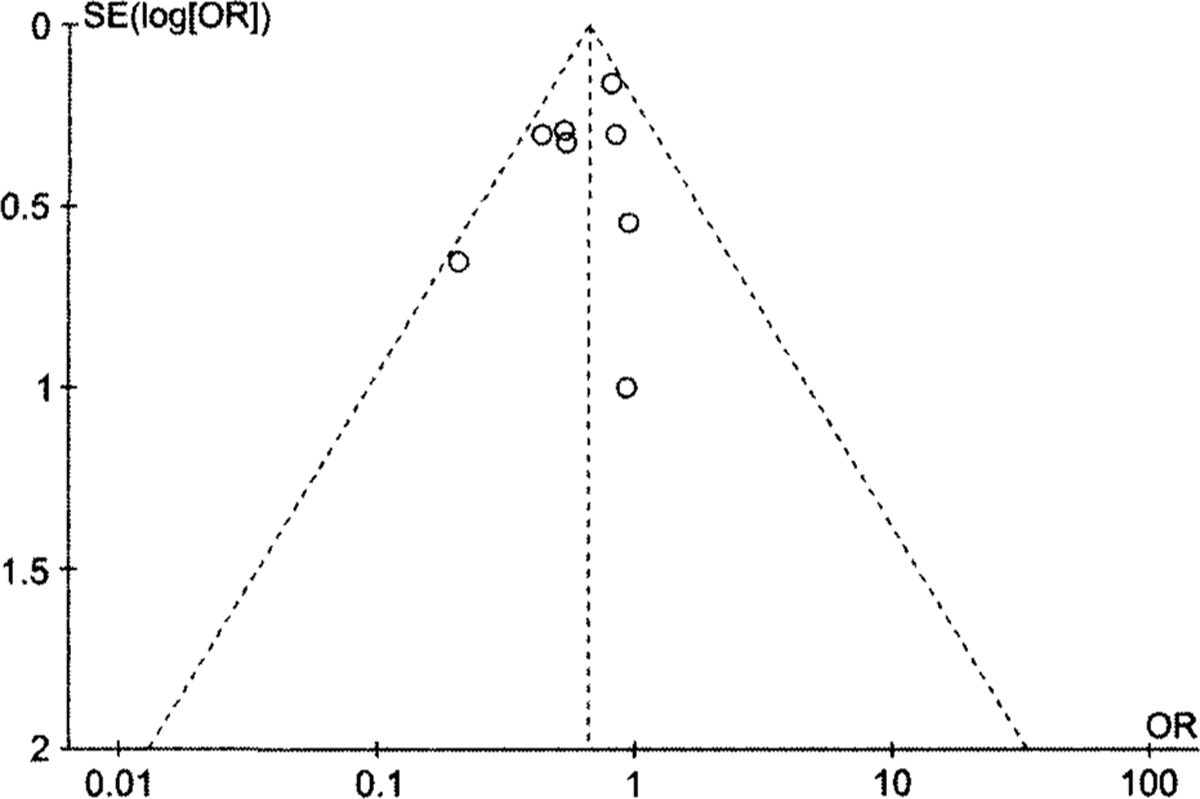
Funnel plot with pseudo 95% confidence limits to assess publication bias in review of mortality in USA300 methicillin-resistant Staphylococcus aureus (MRSA) invasive infections compared with non-USA300 MRSA invasive infections. Funnel plot created in Cochrane Review Manager, version 5.2.5 for Windows, using the fixed-effects model for illustrative purposes. Each circle represents a separate study for the indicated association. Vertical line represents the fixed-effect summary estimate (estimated using inverse variance); sloping lines represent the expected 95% confidence limit for a given SE, assuming no heterogeneity between the studies.