Figure 8.
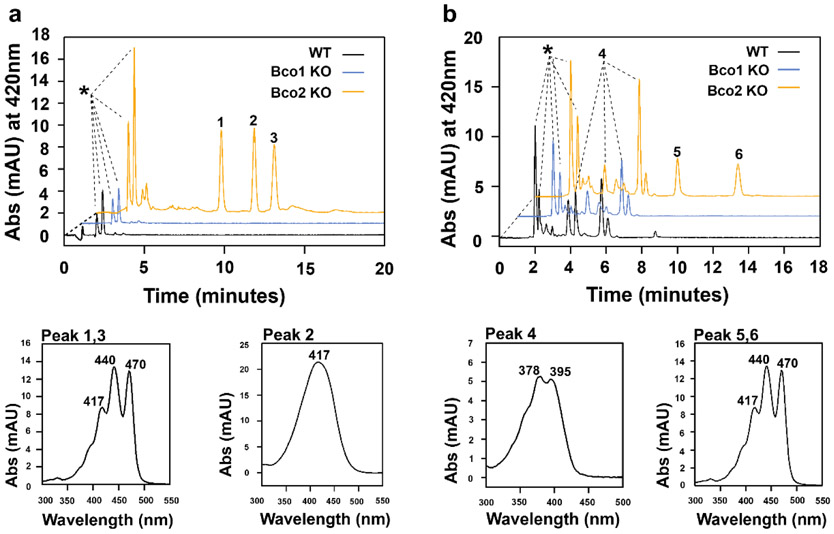
Apocarotenoids accumulate in BCO2-deficient mouse liver. a) HPLC traces at 420 nm of lipid extracts of mice gavaged with 3-hydroxy-β-apo-12’-carotenal. The peaks indicated by asterisks are retinoid peaks (retinyl esters and all-trans-retinol). Lower left panel is UV-visible absorption spectra of unknown dietary compounds (peak 1 and 3) and lower right panel is 3-hydroxy-β-apo-12’-carotenal (peak 2). b) HPLC traces of lipid extracts of mice gavaged with β-apo-10’-carotenal. The peaks indicated by asterisks are retinoid peaks (retinyl esters and all-trans-retinol). Lower left panel is UV-visible absorption spectra of β-apo-10’-carotenol (peak 4) and lower right panel is the two unknown dietary compounds (peaks 5 and 6).

