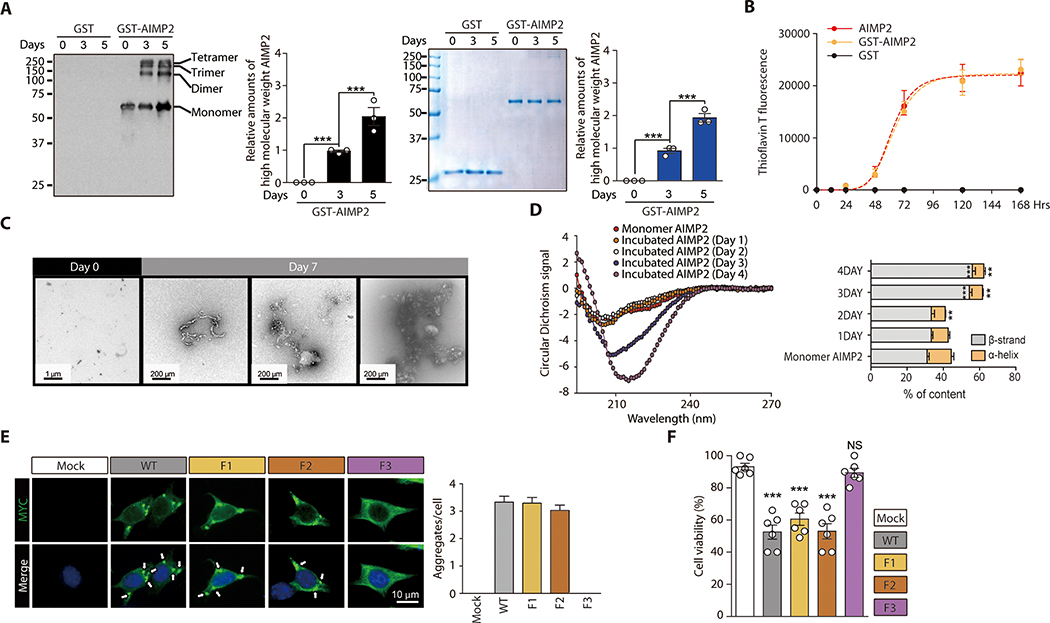
Figure 1. Amyloid-like self-oligomerization and cell toxicity by AIMP2.
(A) Aggregation of recombinant GST-AIMP2-FLAG (50 uM) in 100 mM sodium acetate buffer (pH 7.5) during in vitro incubation based on Western blot analysis and Coomassie brilliant blue staining. Quantification of AIMP2 Western blots and Coomassie bands (n = 3).
(B) Amyloid formation for GST, GST-AIMP2-FLAG or AIMP2-FLAG (50 uM) incubated in vitro for indicated days determined by ThT fluorescence staining (n = 3).
(C) Ultrastructure of native or aggregated recombinant GST-AIMP2-FLAG (7 d incubation) monitored by TEM.
(D) CD spectra of AIMP2 monomer and aggregates formed during incubation for the indicated days (left panel). Secondary structure analysis by Dichroweb (n =3 experiments, right panel, statistical comparisons with monomer AIMP2)
(E) Aggregate formation in SH-SY5Y cells transfected with MYC-tagged wild type AIMP2 (WT), and deletion mutants monitored by immunofluorescence (left panel). Quantification of aggregate puncta number per cell (n = mock 136, WT 115, F1 124, F2 120 cells total from 6 slides, right panel).
(F) Trypan blue exclusion cell viability assay for SH-SY5Y cells transfected with the indicated constructs (48 hrs) (n = 6 per group).
Quantified data are expressed as mean ± SEM. Statistical significance was determined by ANOVA test with Tukey post-hoc analysis, **p < 0.01, and ***p < 0.001; NS: not significant.

