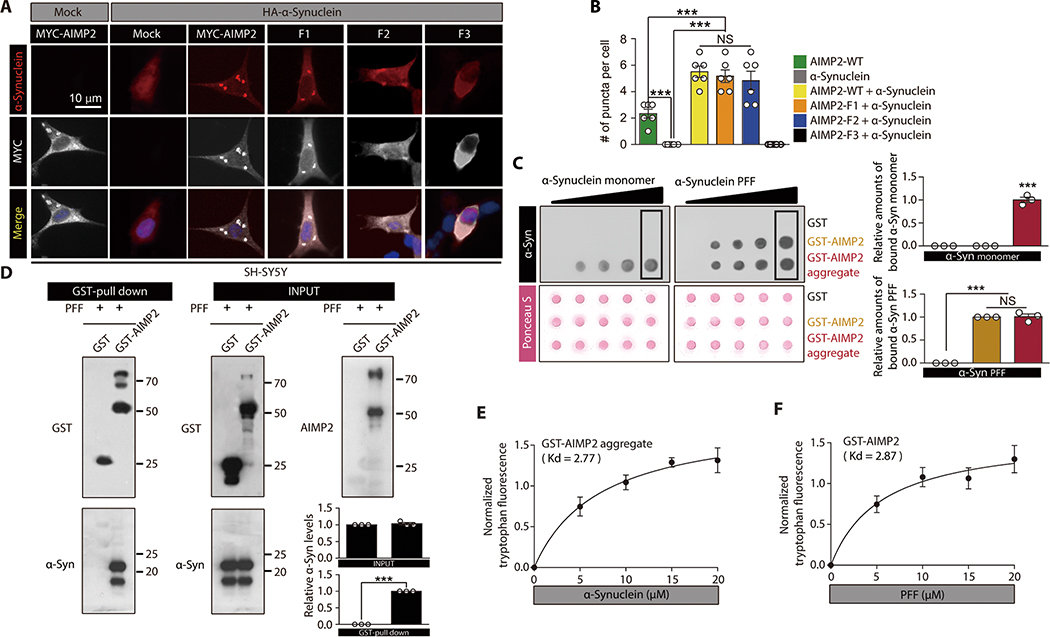
Figure 2. Interaction between AIMP2 and α-synuclein is conformation specific.
(A) Immunofluorescence images showing co-localization and perinuclear aggregation of α-synuclein with AIMP2 in SH-SY5Y cells with the indicated transfections. The MYC signal is peudo-colored for original green fluorescence.
(B) Quantification of aggregates puncta with AIMP2 or α-synuclein in panel A (n = 6 slides per group, analyzed cell number is presented in data file S1)
(C) Dot blot analysis showing specific interaction of either α-synuclein monomer with AIMP2 aggregate or PFF with both monomeric and aggregate AIMP2. Equal loading was confirmed by Ponceau S staining. Affinity association of monomeric or fibril α-synuclein with blotted proteins were evaluated by using anti-α-synuclein antibody. Quantification of the boxed dot blot intensities (n = 3, right panel).
(D) Direct physical association of recombinant AIMP2 with PFF determined by a GST pull down assay. Quantification of Western blots (n = 3, right panel).
(E) Tryptophan fluorescence measurement of aggregated GST-AIMP2-FLAG (10 uM) incubated with increasing amounts of recombinant α-synuclein (n = 4 per group).
(F) Tryptophan fluorescence measurement of GST-AIMP2-FLAG (10 uM) incubated with increasing amounts of sonicated recombinant PFF (n = 4 per group).
Quantified data are expressed as mean ± SEM. Statistical significance was determined by ANOVA test with Tukey post-hoc analysis or unpaired two-tailed Student’s t-test, ***p < 0.001; NS: not significant.

