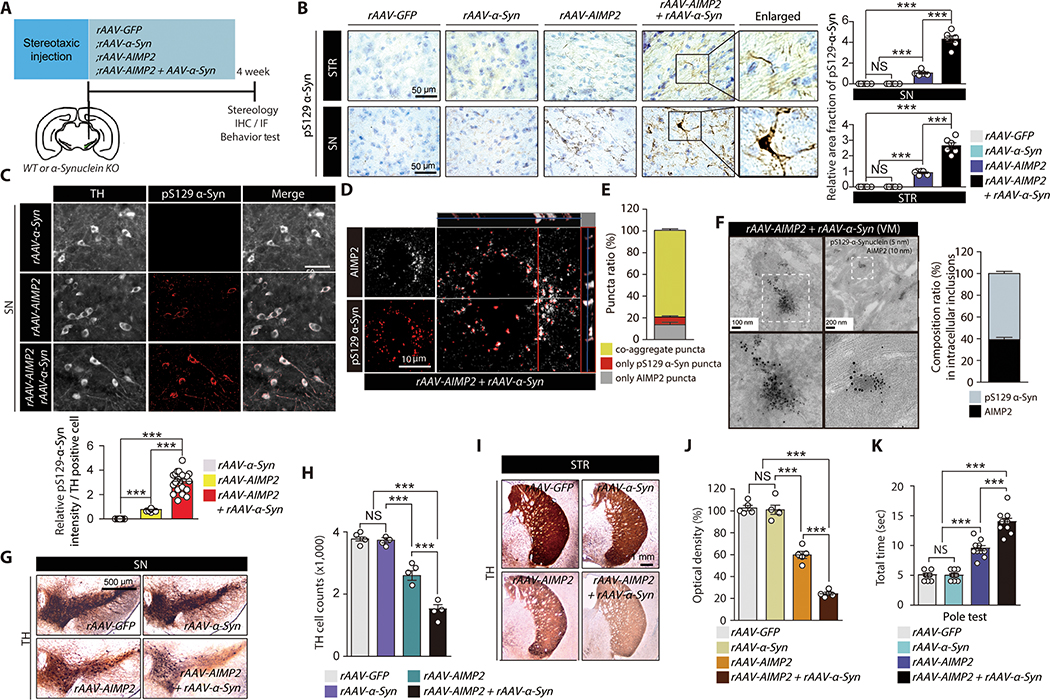
Figure 4. Co-expression and interaction of AIMP2 and α-synuclein in vivo enhanced α-synuclein aggregation and dopaminergic cell loss.
(A) Schematics of in vivo rAAV nigral injection to 2 month old C57BL/6 or α-synuclein KO mice. Experimental schedules for Western blot (WB), immunohistochemistry (IHC), TH stereology, and behavior test are indicated.
(B) Neuropathological assessment (Nissl counter stain) of phosphorylated α-synuclein in nigral and striatal sections from the indicated experimental mouse groups. Quantification of pS129-α-Syn immunohistochemistry (n = 6 slides from 3 mice per group, right panel).
(C) Immunofluorescence images showing pS129-α-synuclein and TH (pseudo-colored for original green fluorescence) expression in SN of mouse brains after intranigral injection of rAAV-α-synuclein, rAAV-AIMP2 or both. Quantification of pS129-α-Syn immunofluorescence (n = 23 cells from 3 mice per group, bottom panel).
(D) Confocal analysis of co-localization and aggregation of phosphorylated α-synuclein and AIMP2 (pseudo-colored for original green fluorescence).
(E) % ratio of aggregates with different composition of AIMP2 or/and phosphorylated α-synuclein (n = 66 cells from 3 mice).
(F) Ultrastructure of inclusion and co-labelling of AIMP2 and pS129-α-synuclein by nanogold particles for VM tissues from mice co-injected with rAAV-AIMP2 and rAAV-α-synuclein. 10 nm and 5 nm nanogold particles were used to detect anti-AIMP2 and anti-pS129-α-synuclein antibodies, respectively. Composition ratio of AIMP2 and pS129-α-Syn in inclusion structures (n = 41 inclusions from 3 mice, right panel).
(G) TH immunohistochemistry of SN sections from the experimental mouse groups.
(H) Stereological counting of dopamine neurons in the SN pars compacta of mouse groups in panel G (n = 4 mice per group).
(I) TH immunohistochemistry of striatum (STR) sections from the experimental mouse groups.
(J) Quantification of striatal TH fiber density for panel I determined by optical density measurement (n = 4 mice per group)
(K) Pole test for mouse groups with nigral injection of the indicated rAAV viruses (n = 11 mice per group).
Quantified data are expressed as mean ± SEM. Statistical significance was determined by ANOVA test with Tukey post-hoc analysis, ***p < 0.001; NS: not significant.

