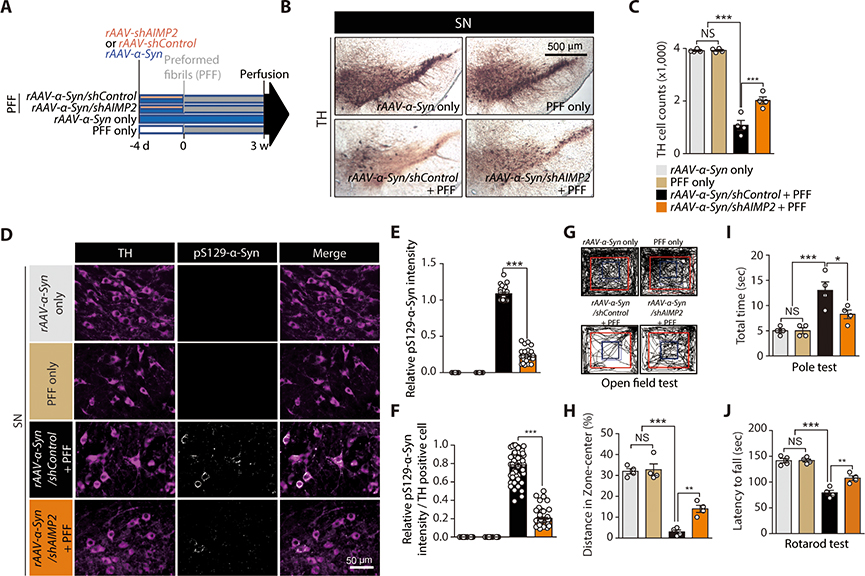
Figure 5. AIMP2 is required for PFF-induced α-synuclein aggregation and toxicity in vivo.
(A) Schematics of in vivo PFF and AAV viruses (expressing AIMP2, α-synuclein, shAIMP2, or shControl) injections to 2 month old C57/BL6 mice. Experimental schedules for virus or PFF injections and perfusion are indicated
(B) TH immunohistochemistry of SN sections from the indicated mouse groups.
(C) Stereological counting of dopamine neurons in the SN pars compacta of the indicated experimental mouse groups (n = 4 mice per group).
(D) Immunofluorescence images showing pS129-α-synuclein and TH expression in the SN of each experimental group. Note, rAAV-shControl and rAAV-shAIMP2 co-express reporter fluorescence GFP and RFP, respectively. pS129-α-synuclein signal is pseudo-colored in white in this image.
(E) Quantification of relative pS129-α-synuclein signal intensities in the VM from the indicated experimental groups (n = 20~29 cells from 4 mice per group).
(F) Quantification of relative pS129-α-synuclein signal intensities in TH-positive dopaminergic neurons of the VM from the indicated experimental groups (n = 60 dopamine cells from 4 mice per group).
(G) Representative exploration paths of mice from each group in the open field test.
(H) Assessment of anxiety in each experimental mouse group determined by % of exploration distance in the center zone (n = 4 per group).
(I) Assessment of bradykinesia in each experimental mouse group monitored by measuring the time taken to descend the vertical pole in pole test (n = 4 mice per group).
(J) Motor coordination of each experimental mouse group determined by latency to fall in accelerating rotarod test (n = 4 mice per group).
Quantified data are expressed as mean ± SEM. Statistical significance was determined by ANOVA test with Tukey post-hoc analysis, *p < 0.05, **p < 0.01, and ***p < 0.001; NS: not significant.

