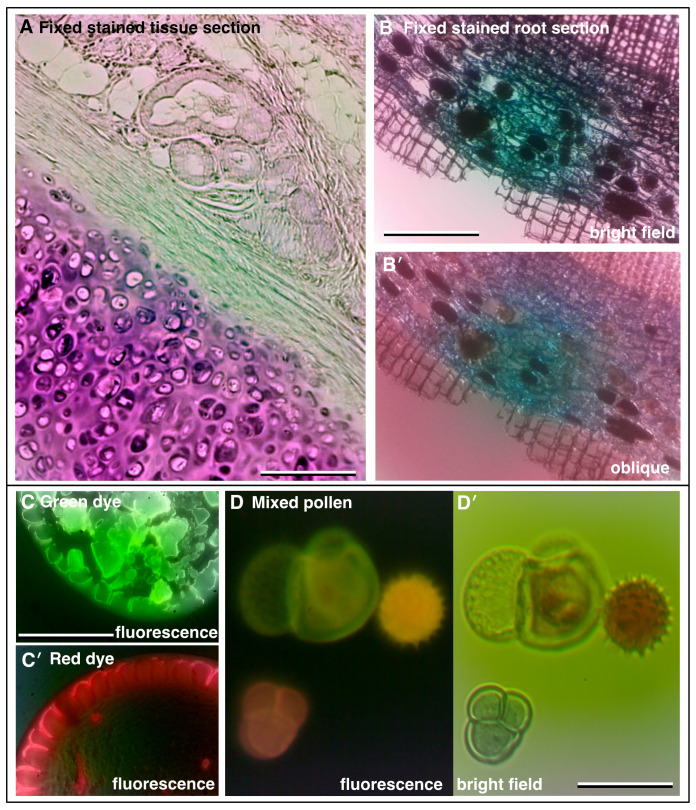
Figure 3. Increasing contrast with colour and fluorescence imaging.
( A) Fixed and sectioned animal tissue, stained with Oil-Red-O showing a range of structures. ( B) Fixed, sectioned and stained root of a plant (Ginko) showing the different cell layers. ( C, C′) Fluorescence images of adjacent dried down puddles of green and red dye, respectively. ( D) Autofluorescence of pollen grains and ( D′) corresponding colour bright field image. (Scale bars = 0.20 mm in A, 0.35 mm in B, 0.35 mm in C and 0.04 mm in D.)

