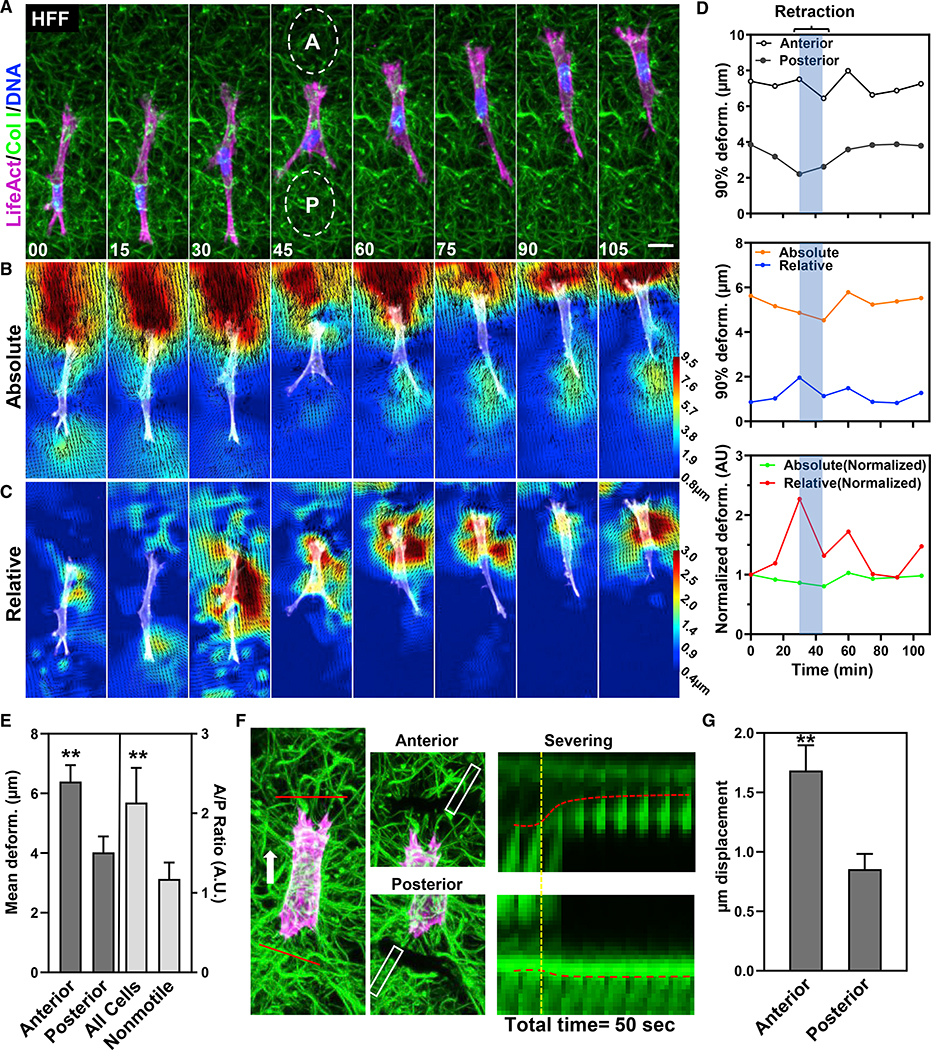
Figure 2. Fibroblasts sustain a matrix prestrain during cell migration.
(A) HFF expressing TagGFP2-LifeAct (magenta) embedded in 3D collagen (green) migrating directionally over time. “A” and “P” (ovals) represent the anterior (A) and posterior (P) deformations shown in (D and E).
(B and C) Absolute (B) and relative (C) deformation of the ECM of the same cell in (A). Time: minutes.
(D) Graphical plots of the data in (B) and (C). Top panel: sustained differences in anterior and posterior strain. Middle and bottom: absolute strain is sustained and high, whereas relative strain is variable and associated with contraction. Bottom: data normalized to the first time point.
(E) Mean (±SEM) deformations of matrix strain anterior and posterior to the cell (n = 17) and A/P ratio for all cells versus nonmotile cells (light gray: n = 17, N = 3).
(F) Tag-GFP2 LifeAct-expressing fibroblast (magenta) in collagen gel (green) prior to and after severing the matrix at anterior and posterior regions (red solid lines). Kymograph shows the local relaxation of the matrix. The yellow-dashed line indicates the time of severing. Red dashed lines show the movement of the matrix.
(G) Matrix displacements after anterior and posterior cuts (mean ± SEM; N = 7). **p ≤ 0.01. Scale bar, 20 μm.

