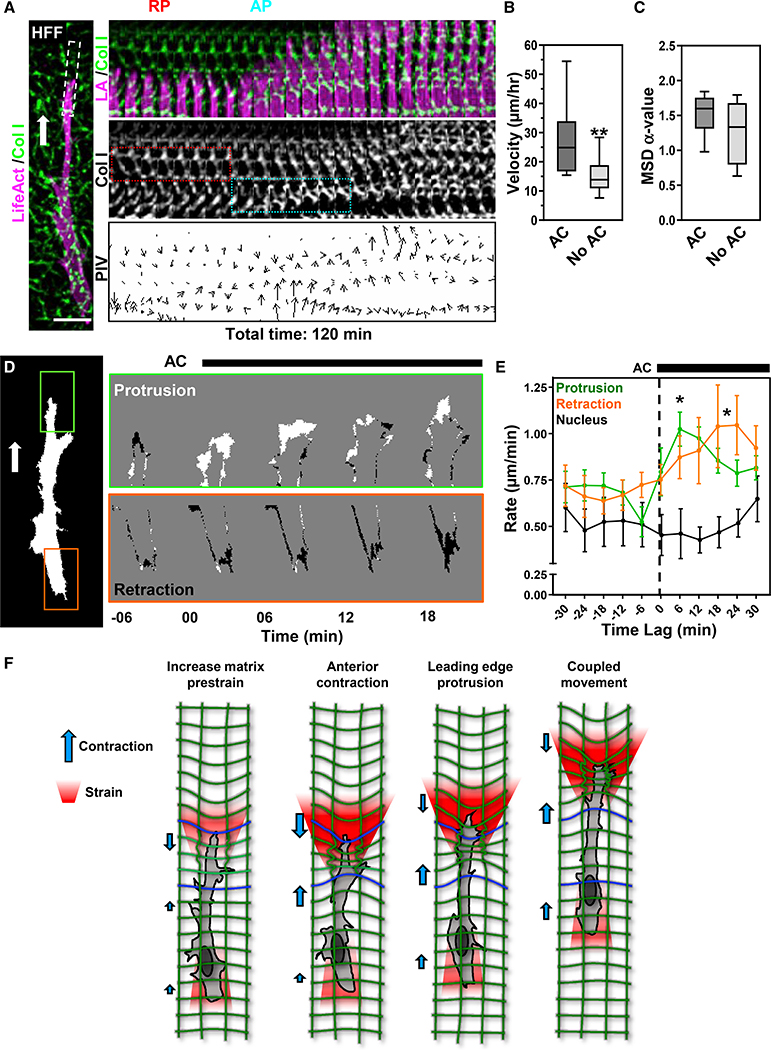
Figure 3. Anterior contraction enhances migration through increased protrusion.
(A) HFF expressing TagGFP2-LifeAct (LA, magenta) in 3D collagen (green) migrating directionally (white arrow). The white box (left) indicates the kymograph area to the right. Kymograph (center) shows a retrograde pull (red box) followed by an anterograde contraction (cyan box) that defines an AC, then protrusion.
(B and C) Effect of an AC on cell velocity (B) and mean-squared displacement (C; **p ≤ 0.01 t test, mean value ± SEM shown, N = 8, n = 40).
(D) A binary mask of the cell in (A) created to analyze protrusion (green box) and retraction (orange box). Time-lapse differential images show protruding (white) and rear-retracting (black) regions.
(E) Temporal analysis of the rate of protrusion (green), nuclear displacement (black), and retraction (orange) centered around AC initiation (time 0; *p ≤ 0.05, mean value ±SEM shown, N = 5, n = 18).
(F) Schematic illustration of how an anterior axial contraction drives matrix prestrain development and protrusion. Scale bar, 20 μm.

