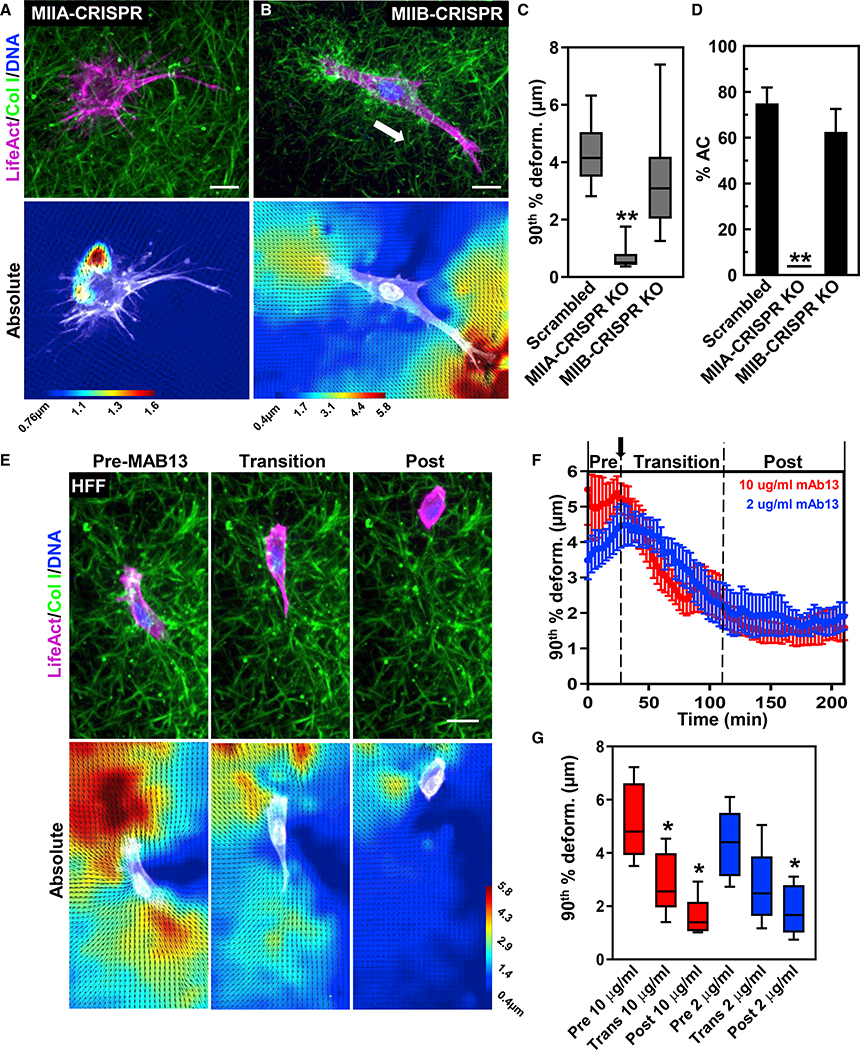
Figure 4. MIIA and integrin ligation are required for cell-matrix prestrain and AC development.
(A and B) Maximum intensity projection of TagGFP2 LifeAct (magenta)-expressing CRISPR knockout MIIA (A) or MIIB (B) fibroblasts in 3D collagen (green). Bottom panels show PIV imaging.
(C) 90th percentile ECM deformations in 3D collagen for scrambled control, MIIA, and MIIB knockouts (**p < 0.01 N = 3, n ≥ 13).
(D) Percent of the same cells undergoing anterior contraction during 3D migration (N = 3, n ≥ 17).
(E) Time-lapse and PIV images of HFF (LifeAct, magenta) migrating in collagen (green) responding to anti-β1 integrin antibody mAb13 addition (2 μg/ml shown).
(F) Graphical plots of mAb13 (10 μg/ml, red; 2 μg/ml, blue) addition on 90th percentile ECM deformations (N = 3, n ≥ 6).
(G) 90th percentile ECM deformations for the pre-, transition, and post-phases (N = 3, n ≥ 6). *p < 0.05 versus pre-phase. For all graphs, mean value ±SEM shown. Scale bars: 20 μm.

