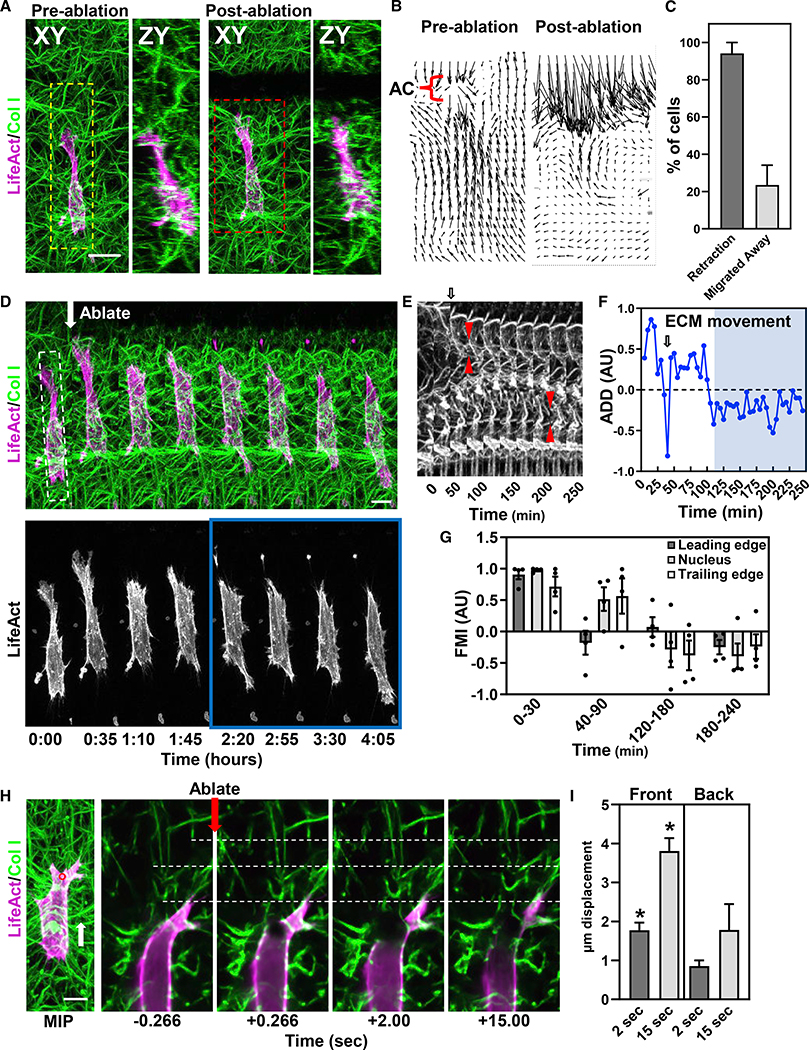
Figure 5. Reduction of ECM prestrain alters migration via cell mechanosensing.
(A) Pre- and post-ablation XY and ZY maximum intensity projections of an HFF (LifeAct, magenta) in 3D collagen (green). A 1003 80 μm (XZ) ECM laser “cut” in front of the cell.
(B) Relative ECM deformation maps for red dashed box region in (B) before and after ablation.
(C) Percent cells undergoing leading-edge retraction or migration away from the ECM cut. N = 7, n = 19.
(D) Time lapse of the cell shown in (A) (yellow-dashed line box).
(E) Kymograph (white-dashed box in D) of the ECM showing an AC (red arrows) before and after the change in ECM deformation from one end of the cell to the other.
(F) Averaged directional deformations (ADD) of the ECM. Arrows in (D) and (F) indicate ablation. Blue region corresponds to the blue box in (D).
(G) Forward migration index (FMI) for LE, NUC, and TE (N = 4).
(H) Cell severing at anterior or posterior regions shows significant differences in local ECM relaxation. Time lapse shows a cell cut anteriorly releasing ECM strain. White-dashed lines are fiduciary marks to visualize ECM displacements.
(I) Analysis of ECM movement for cells severed at the front and back. (N = 4, n = 11), *p ≤ 0.05. For (C), (G), and (I) mean value ±SEM shown. Scale bars, 10 μm.

