Figure 1).

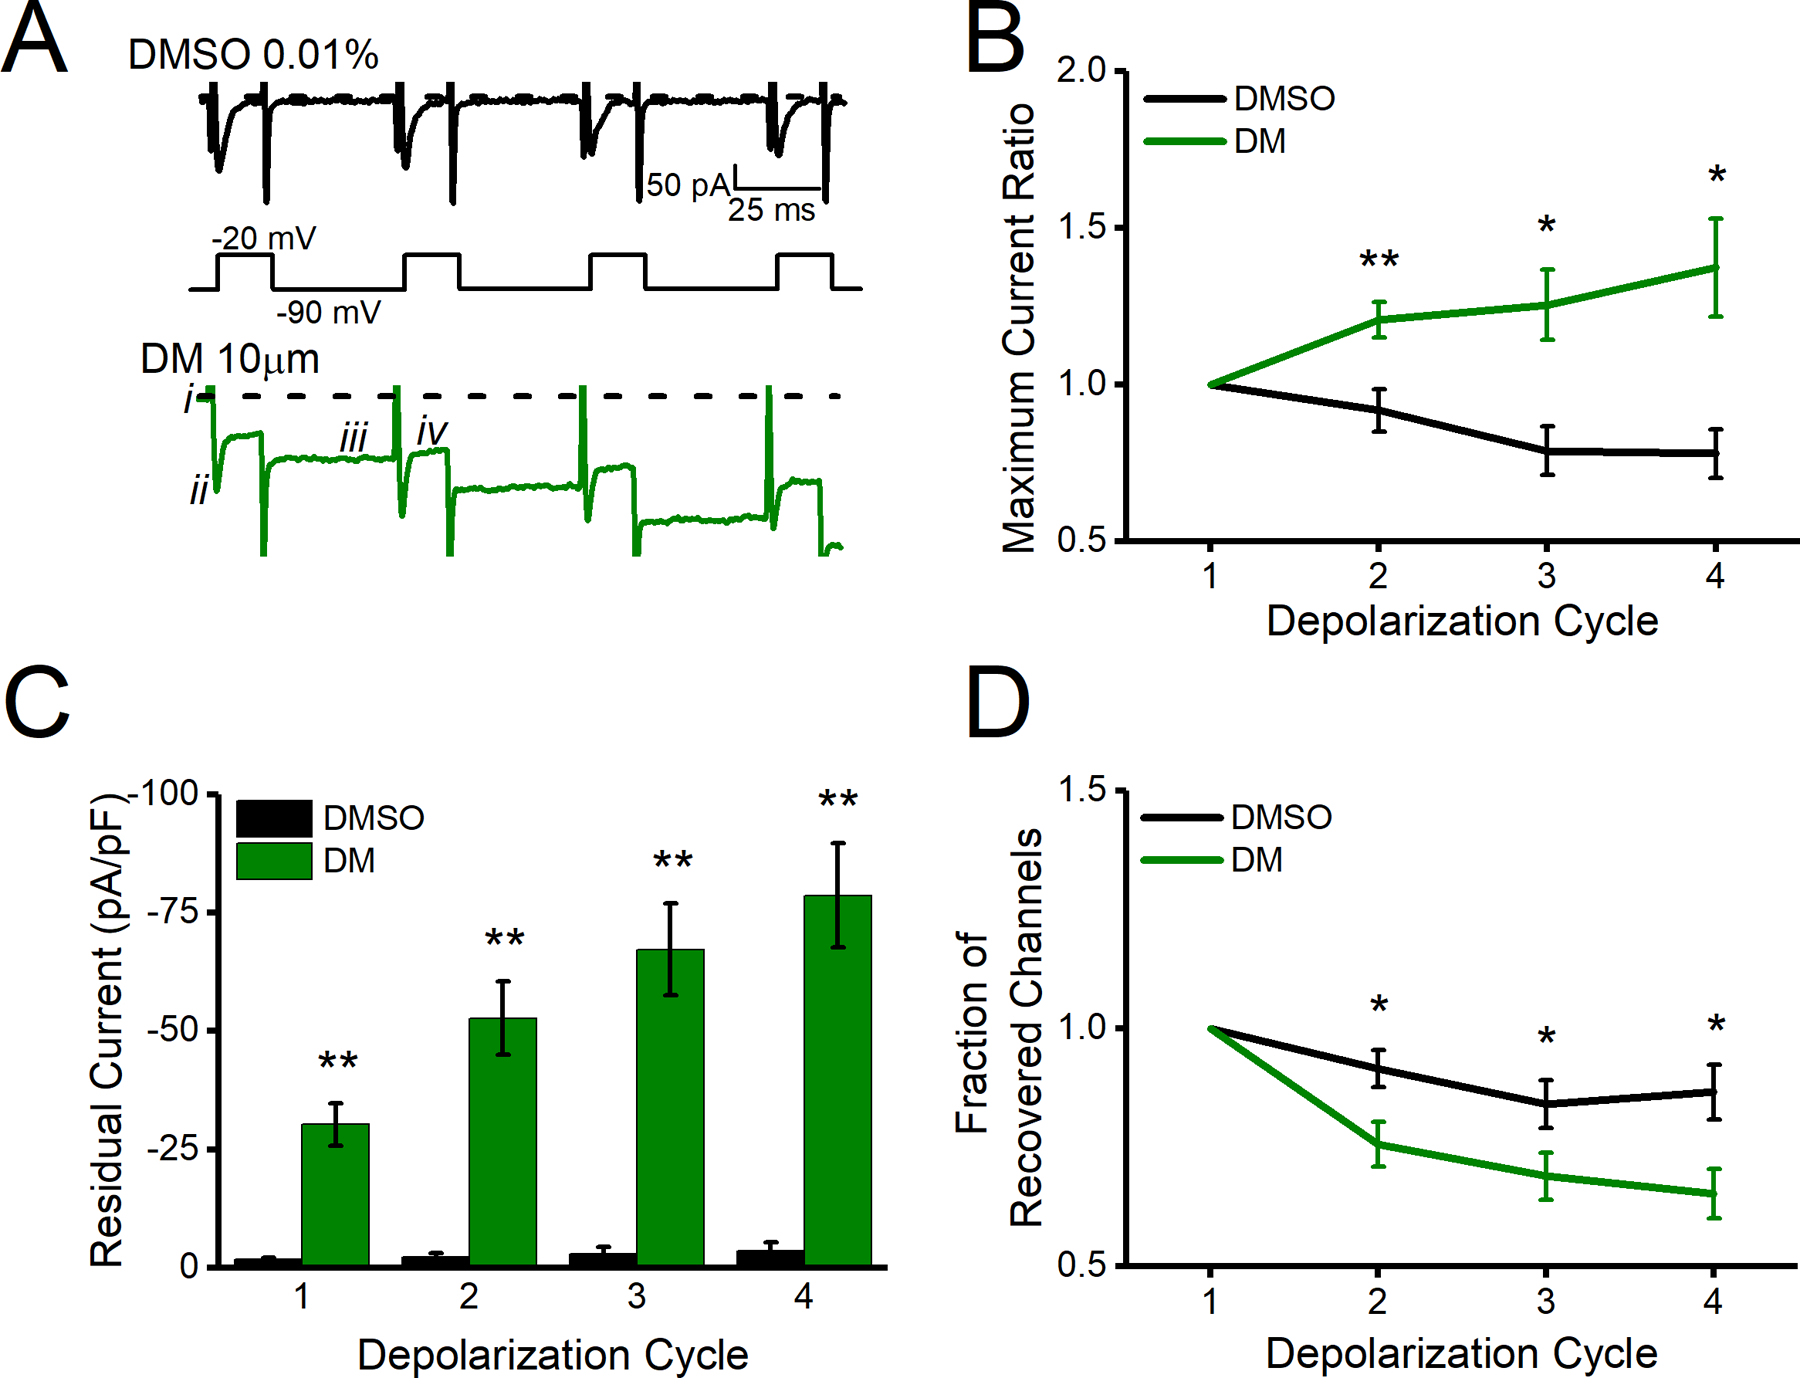
A. Representative traces of transient currents following repeated evoked changes in voltage (schematic under traces) with DMSO shown in black and DM shown in green. B. Maximum current ratio measured from i to ii for all depolarization cycles. C. Residual current measured as i to iii for all depolarization cycles. D. Fraction of recovered channels at measured from i to ii for the first depolarization cycle and ii to iv for subsequent cycles. All data are represented as mean ± SEM. *p<0.05, **p< 0.01.
