Figure 3).

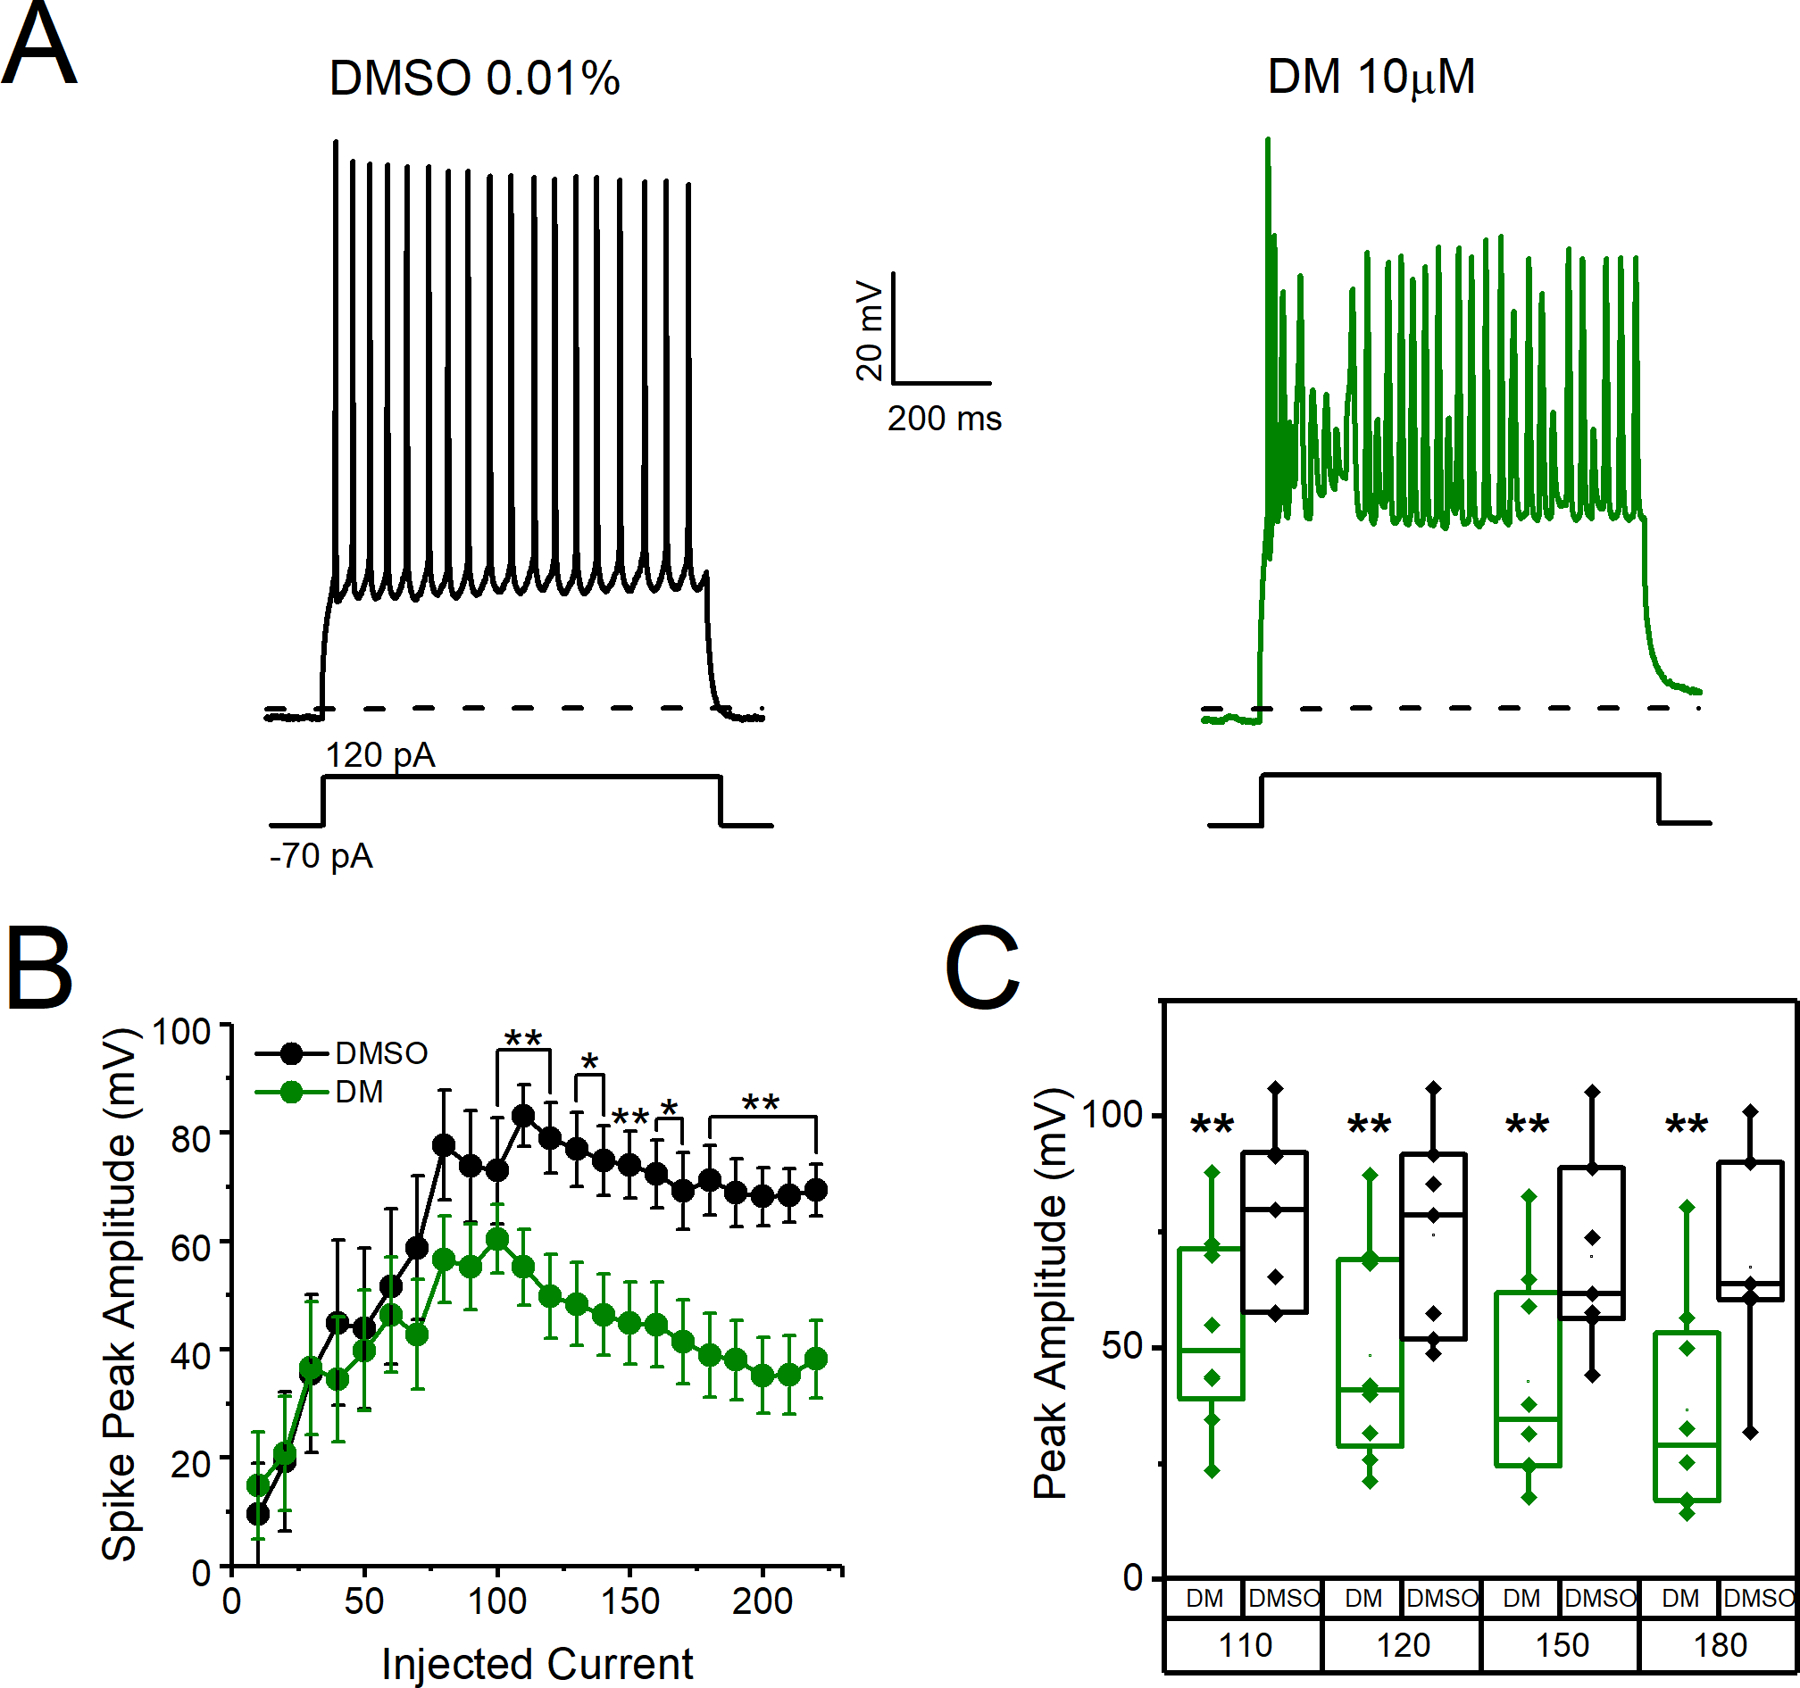
A. Representative traces of evoked action potential traces in response to current injection in MSNs of C57BL/6J mice following 30-minute incubation of coronal brain slices in DMSO (0.01%) or DM (10 μM). B. Peak amplitude of action potentials versus injected current steps. C. Peak amplitude of action potentials at 110, 120, 150, and 180 pA of injected current. Data here depict the amplitude of each cell at a particular current step and are extracted from Fig. 3B. All data are represented as mean ± SEM. *p<0.05, **p< 0.01.
