Figure 5.

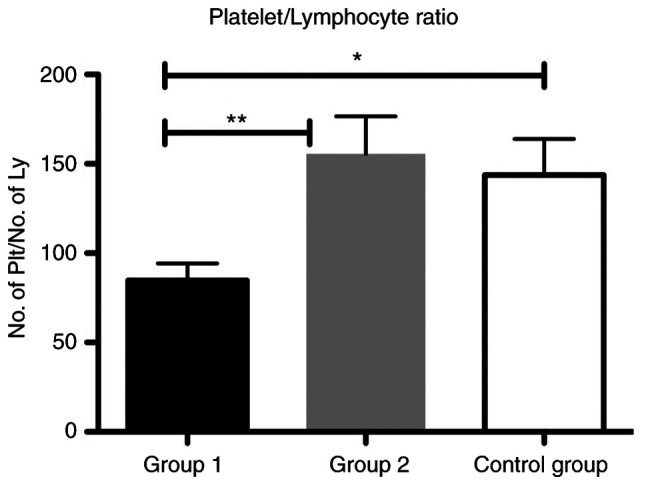
Bar plot (mean ± SEM) of PLR in the liver cirrhosis patients from group 1 and 2 compared with the control group. One-way ANOVA test, *P<0.05, **P<0.01. PLR, platelet/lymphocyte ratio.

Bar plot (mean ± SEM) of PLR in the liver cirrhosis patients from group 1 and 2 compared with the control group. One-way ANOVA test, *P<0.05, **P<0.01. PLR, platelet/lymphocyte ratio.