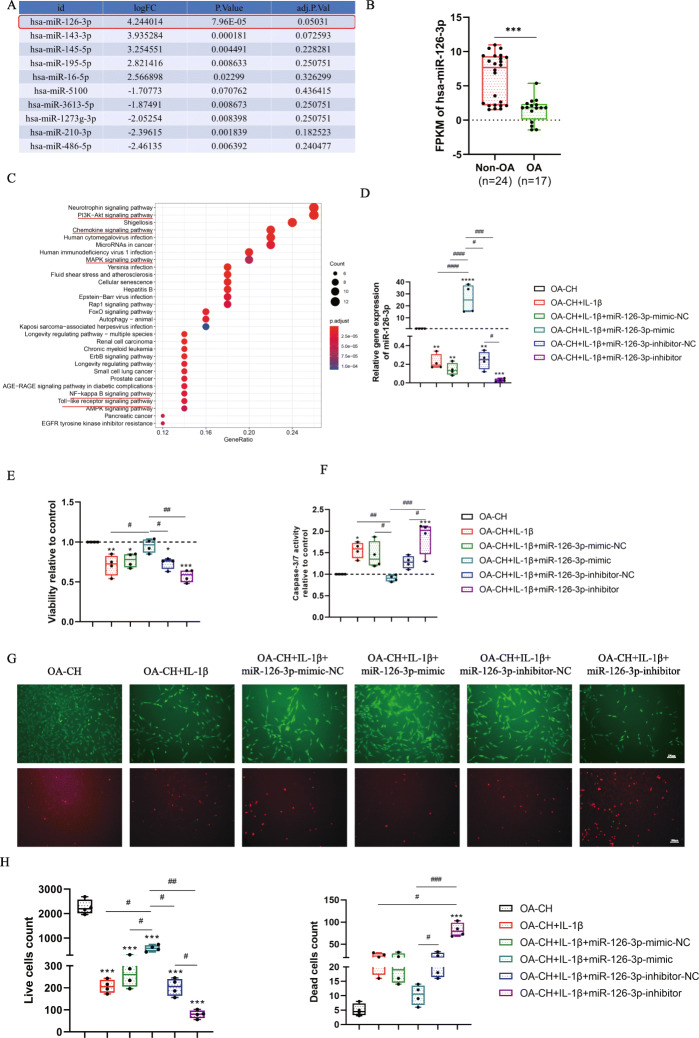
Fig. 6.
Bioinformatic analysis and gene expression of hsa-miR-126-3p in chondrocytes and the effect of hsa-miR-126-3p on the viability and apoptosis of IL-1β-induced OA-CH. a Top 10 differentially expressed miRs in non-OA and OA cartilage samples. LogFC:log fold change of different FPKM (fragments per kilobase of exon model per million mapped fragments) in non-OA cartilage compared with OA cartilage. b FPKM analysis of hsa-miR-126-3p in Non-OA and OA cartilage samples; independent two-tailed Student’s t tests, ****p < 0,001. c KEGG pathway enrichment of targeted genes of hsa-miR-126-3p. d Relative expression of transfected hsa-miR-126-3p mimic, inhibitor, and respective controls measured by qRT-PCR in OA-CH after IL-1β stimulation, n = 4. e Viability and apoptosis of OA-CH after treatment with IL-1β and transfection of the different miR groups; n = 4; g–i 24 h after treatment with IL-1β and transfection with different miR groups, live/dead OA-CH were visualized by fluorescence microscopy after labeling cells with calcein and ethidium homodimers. Living cells were labeled with calcein (green fluorescence) and dead cells were stained with ethidium homodimer (red fluorescence); n = 4. Difference to control (OA-CH): *p < 0.05; **p < 0.01; ***p < 0.001; ****p < 0.0001; #difference between groups: #p < 0.05; ##p < 0.01; ###p < 0.001; ####p < 0.0001; 1-way ANOVA with Newman-Keuls multiple comparison test. NC, negative control

