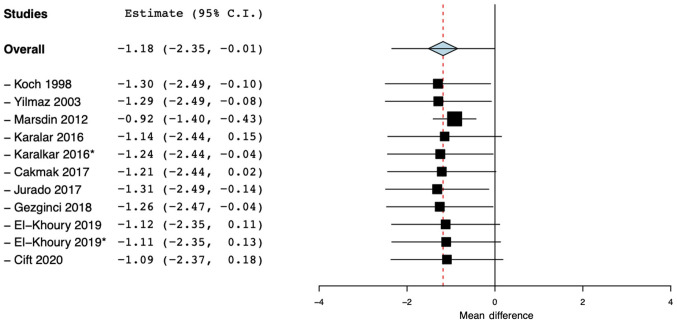
Figure 3.
Sensitivity analysis of pain outcome presenting the resultant effect size after exclusion of one study at a time. Black squares in front of each study indicate the effect size and horizontal lines indicate the 95% confidence intervals, after exclusion of that study from the analysis. *Indicates different sub-group from the same study.

