
FIGURE 2.
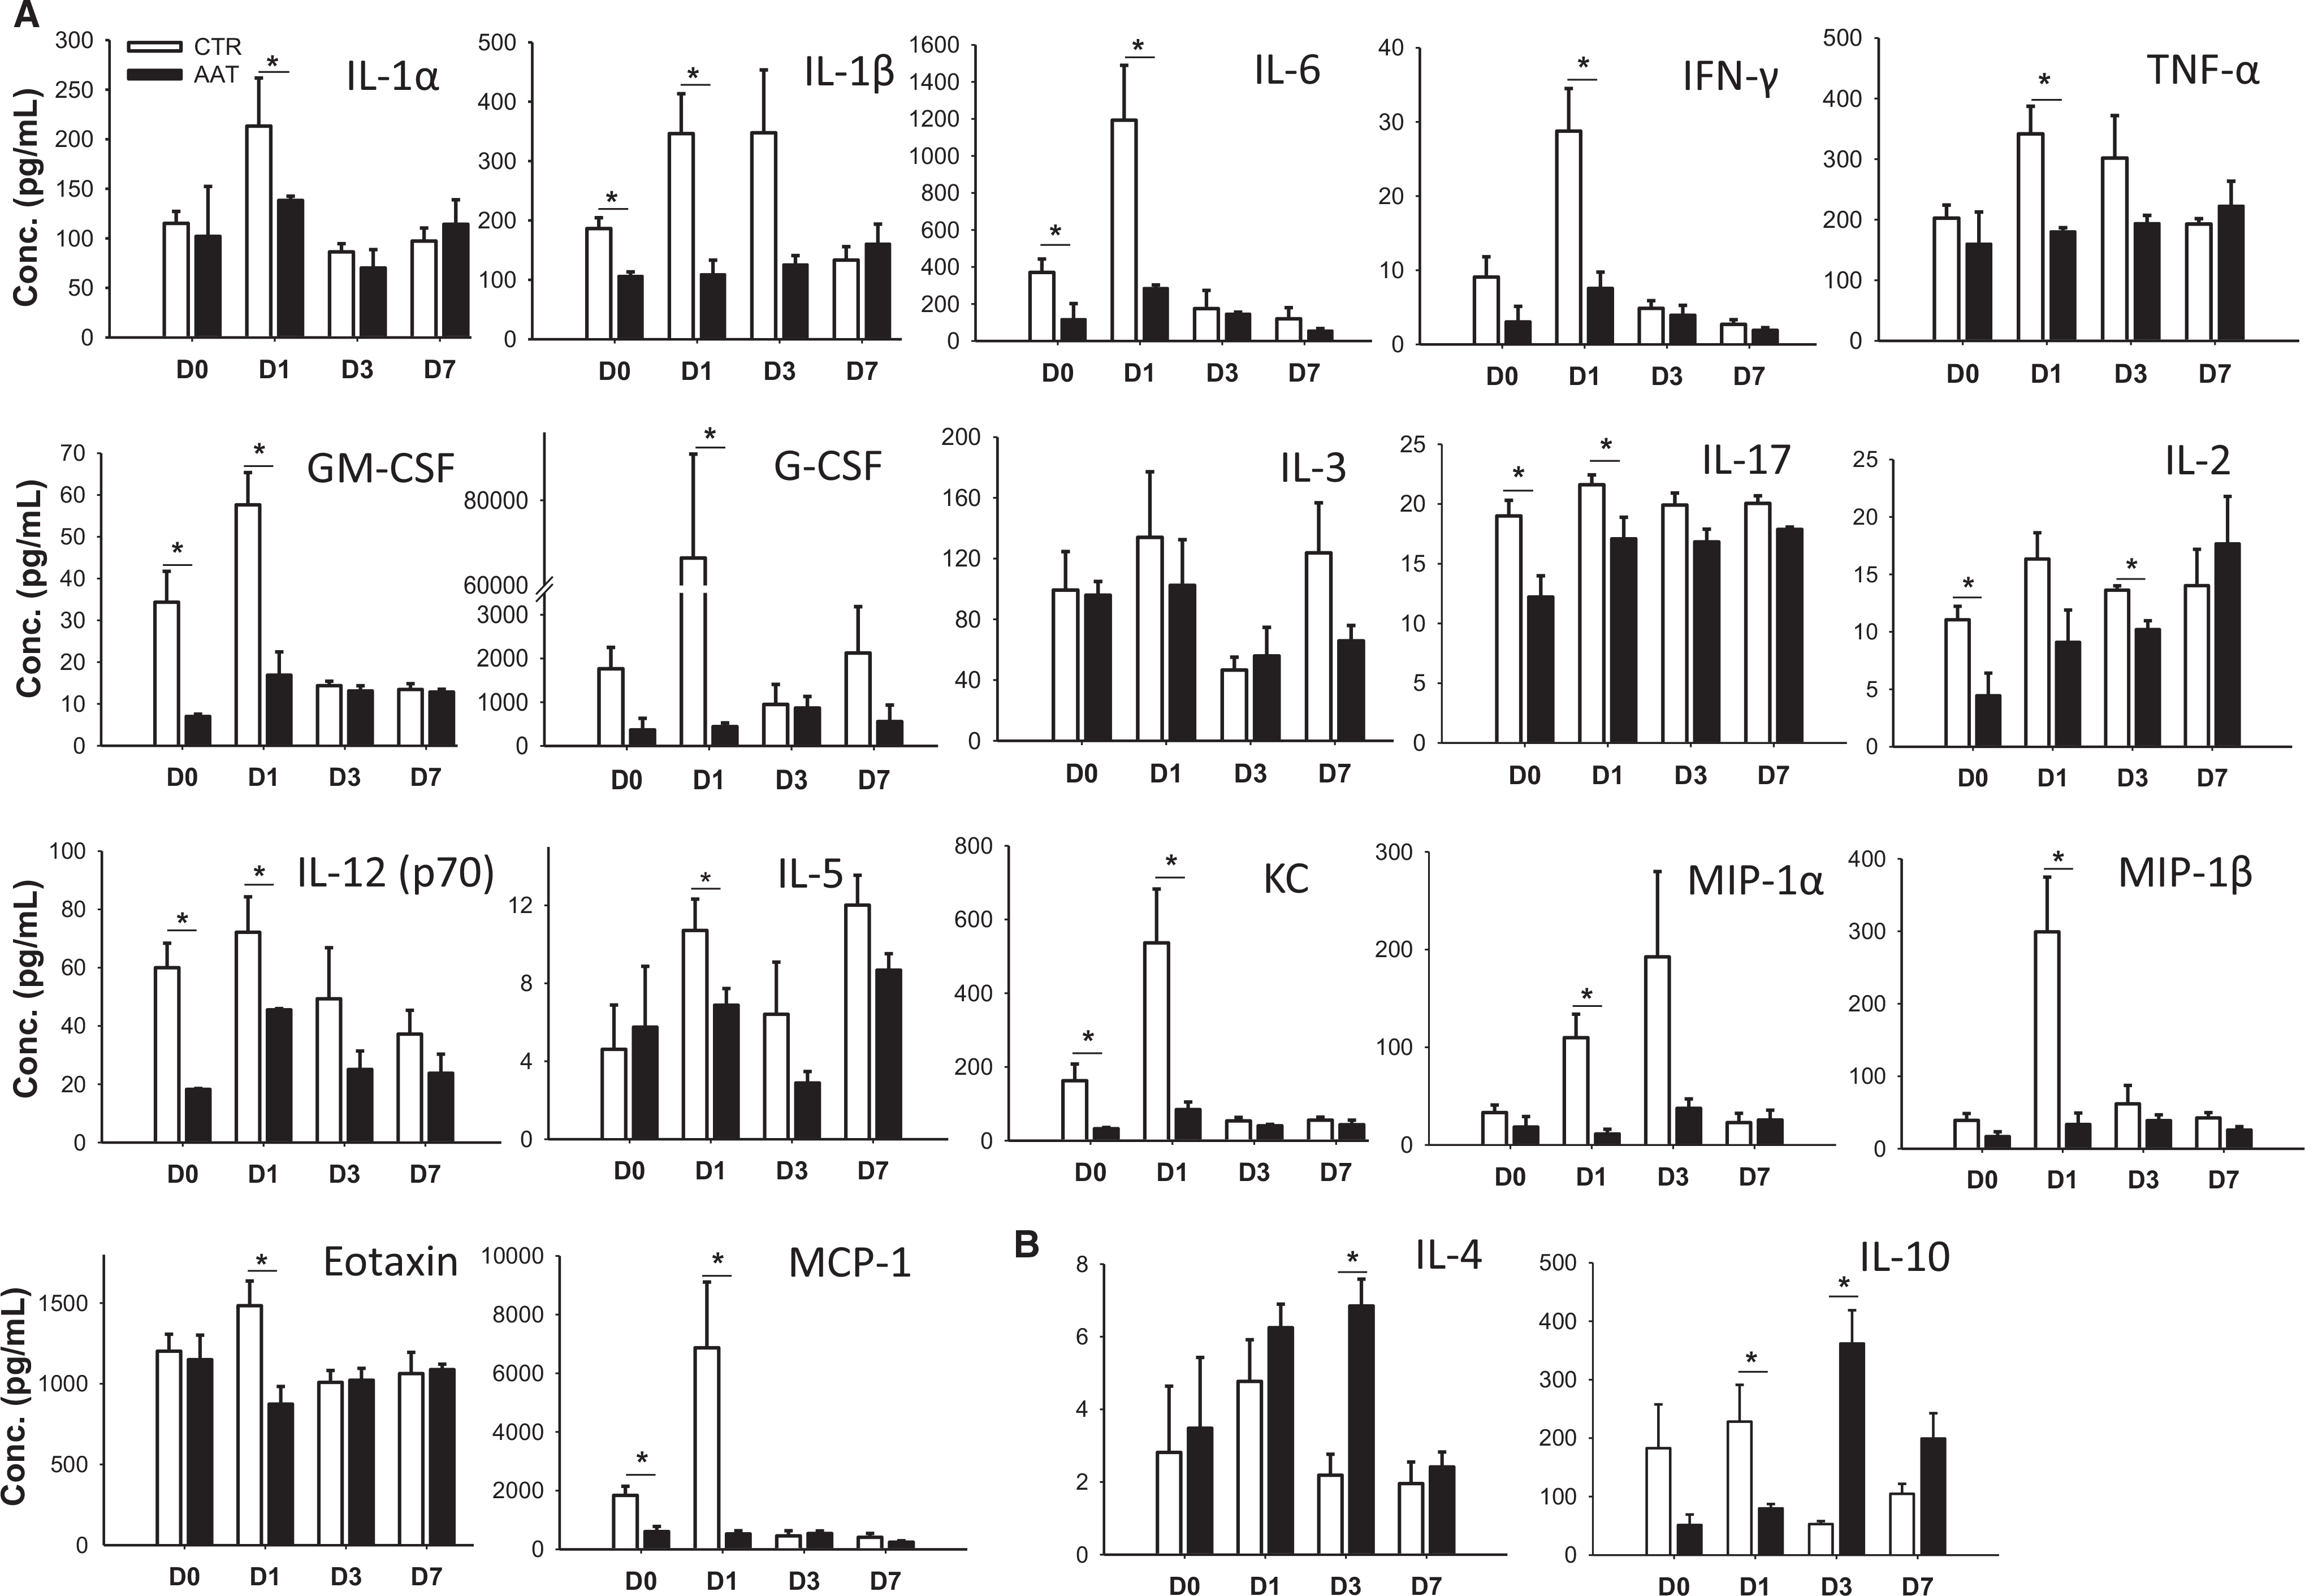
Cytokine levels in AAT or control recipients after transplantation. (A) Serum cytokines and (B) IL-4 and IL-10 levels from AAT or CTR mice at 0, 1, 3, and 7 days posttransplant measured by the Bio-Plex Pro Cytokine 23-Plex Assay kit. Data are shown as mean ± SEM, n = 3–4 in each time point; *P < .05 by Student's t test