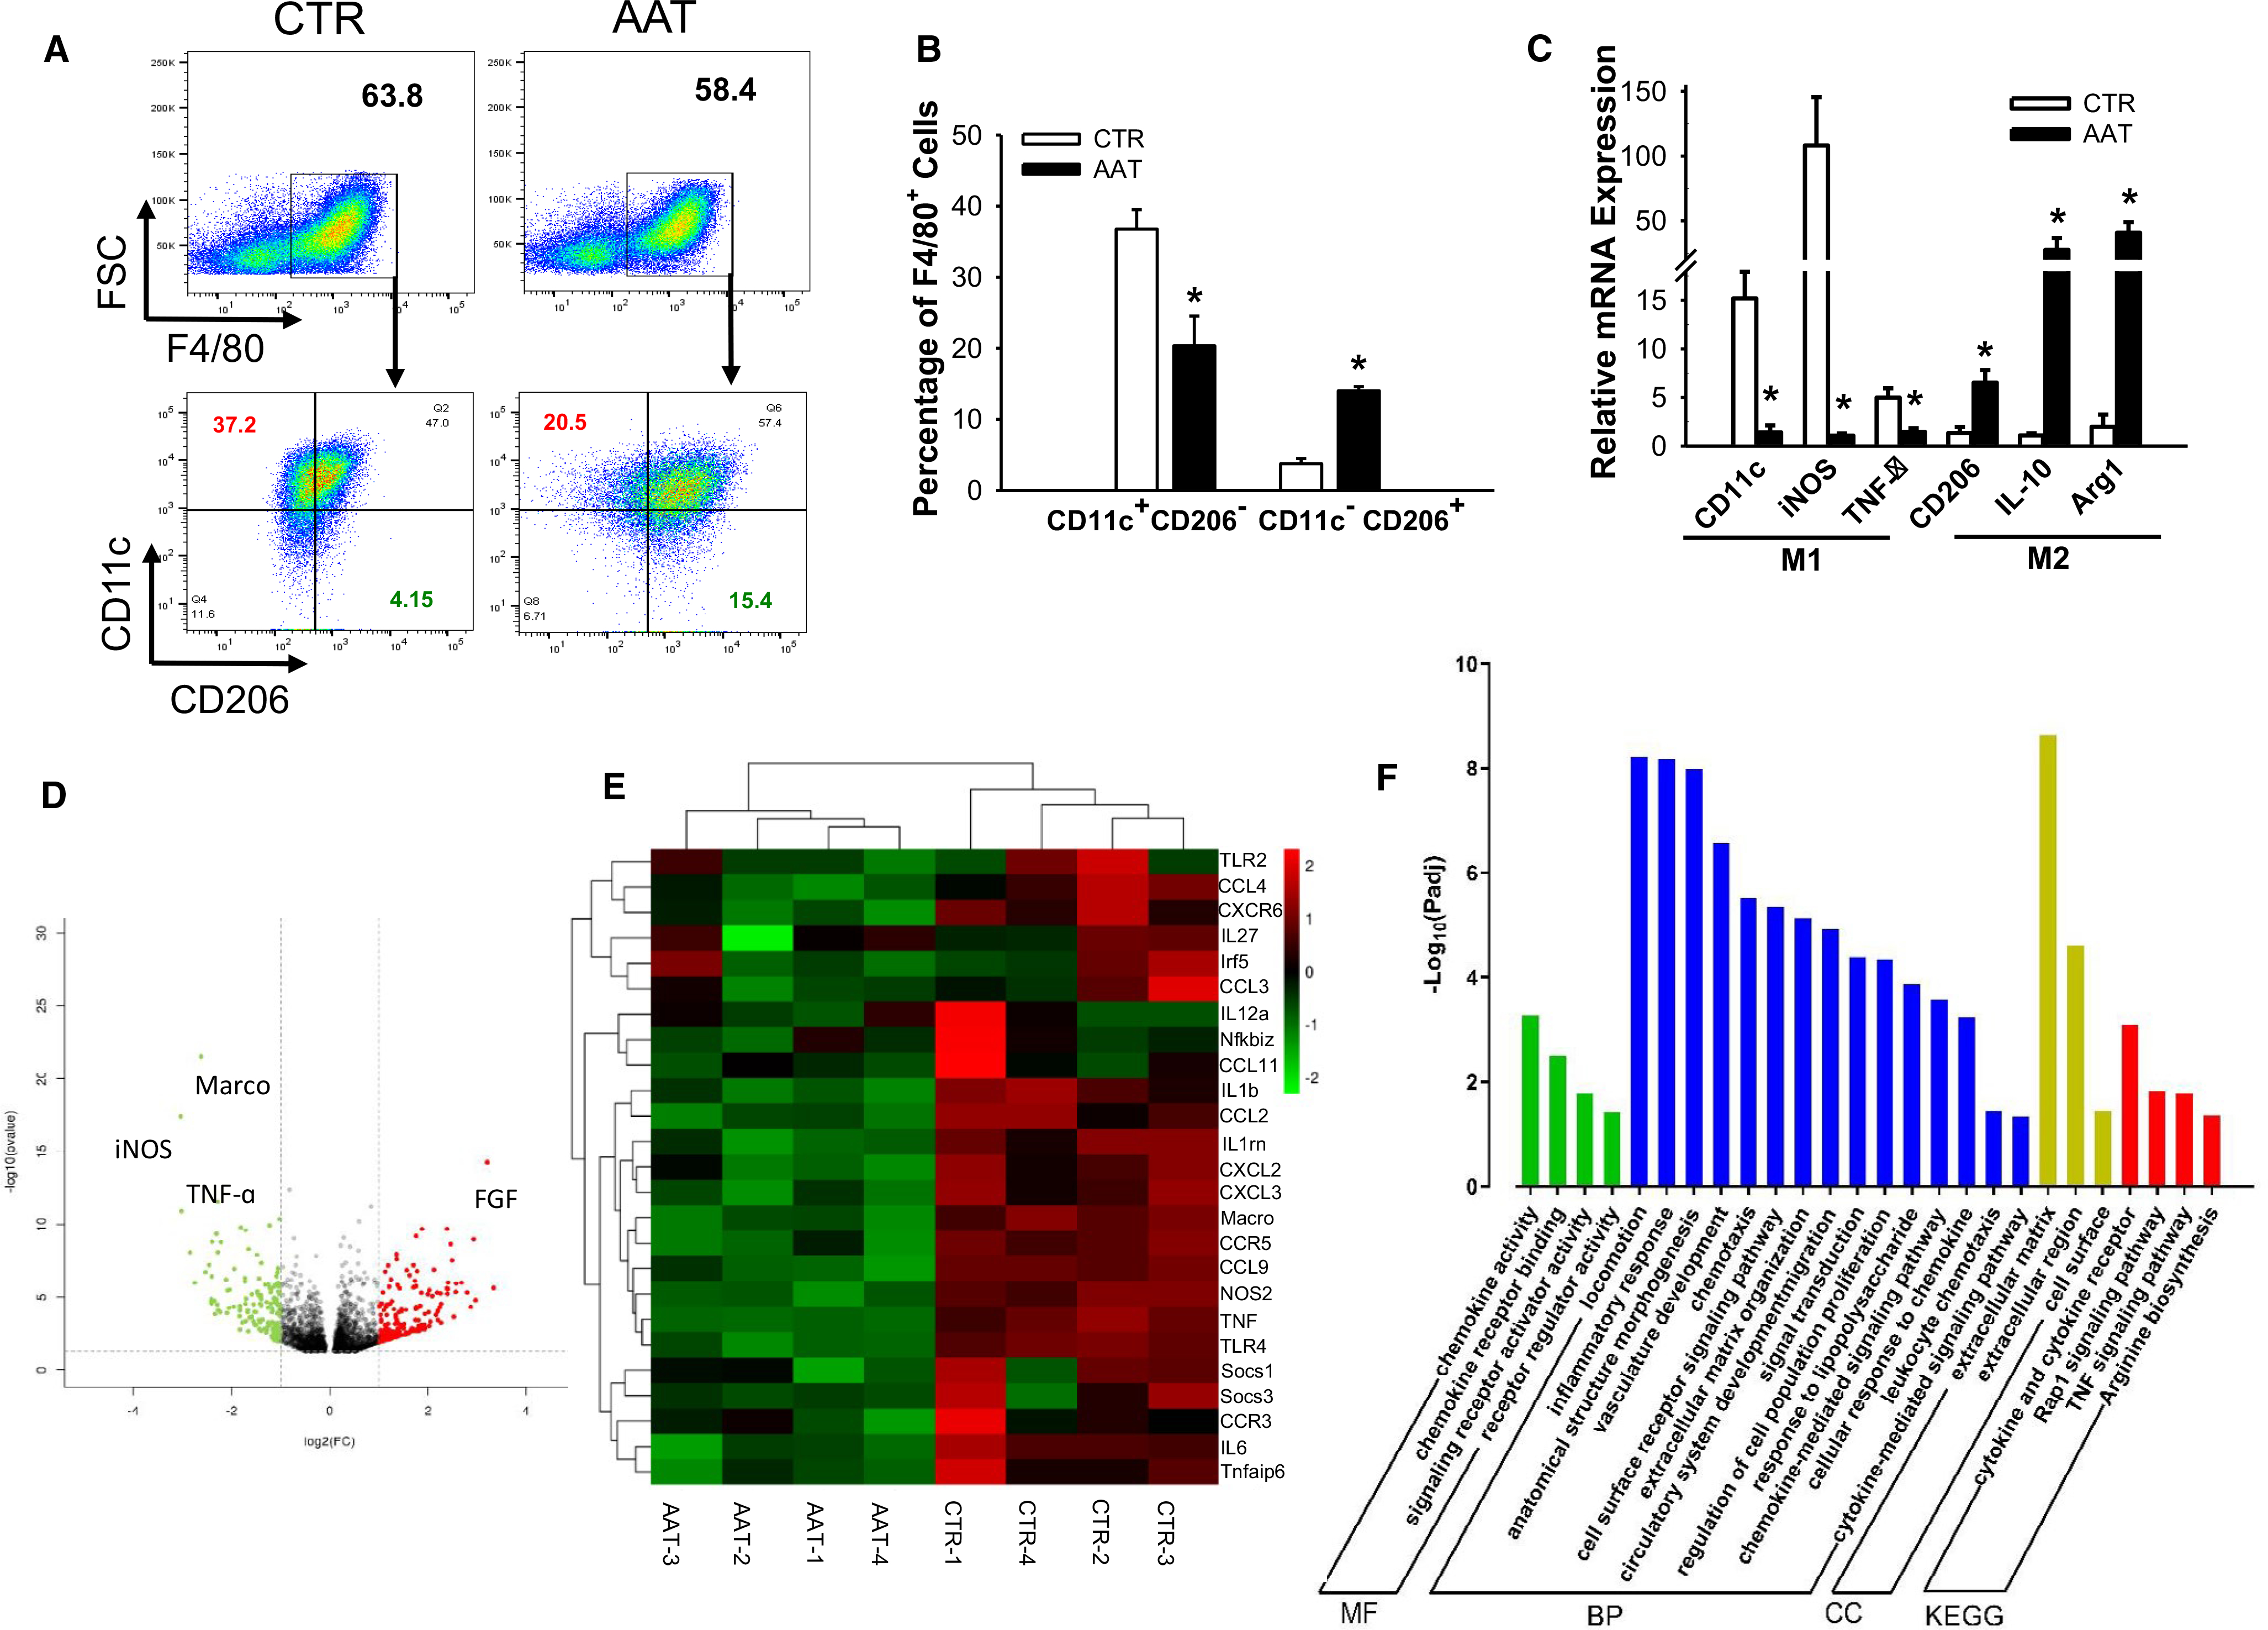
FIGURE 3.

Liver macrophage transcription profiles from AAT-treated mice show reduced M1 percentages at 1-day PT. (A) Flow cytometric plots showing expression of F4/80 (upper panel), CD11c, and CD206 (lower panels) in liver macrophages harvested from AAT or control mice. (B) Quantification of M1 (F4/80+CD11c+CD206−) and M2 (F4/80+CD11c−CD206+) macrophages in livers. (C) Relative mRNA expression of the M1 (CD11c, iNOS, and TNF-α, left panel) and M2 (CD206, IL-10, and Arg1, right panel) marker genes measured by RT-PCR. Data are presented as mean ± SEM; n = 6 in each group; *P < .05 by Student's t test. (D) Volcano plot of differentially expressed genes between control (CTR) and AAT-treated groups (AAT). (E) Heatmap of consensus M1 macrophage-related genes. Each column represents data from an individual AAT-treated or control mouse and each row represents a gene. Gene expression is shown by pseudocolor scale (−2 to 2), with red denoting high expression level and green denoting low expression level of a gene. (F) Pathway and Gene Ontology analysis of genes downregulated in AAT-treated mice macrophages. MF, molecular function; BP, biological process; CC, cellular component; KEGG, Kyoto Encyclopedia of Genes and Genomes
