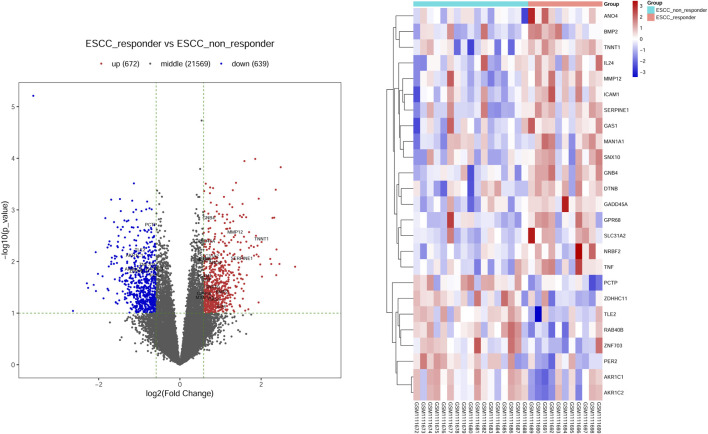
FIGURE 2.
Screening the differential expression genes (DEGs) in ESCC-nCRT responder and non-responder samples. (A) Volcano plot visualized the distribution of DEGs. Red dots represented up-regulated genes and blue dots were down-regulated genes. The overlapped genes were named in figures represented the up-regulated or down-regulated genes in both datasets. (B) Bidirectional clustering analysis of DEG in nCRT responder and non-responder samples. These genes are overlapped genes dysregulated in both datasets. The color changed from blue to red represented the expression level from low to high.

