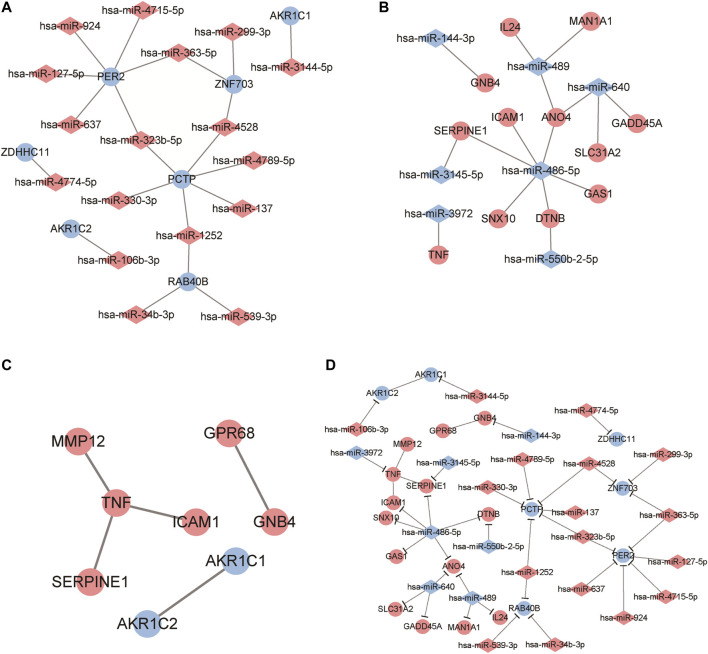
FIGURE 4.
Identification of candidate genes based on protein-protein interaction (PPI) network analysis and miRNA-mRNA regulatory network construction. (A, B) Regulatory network visualized the correlation of dysregulated miRNA and mRNAs in ESCC samples. The circles represent mRNA while diamonds refer to miRNAs. Red mean to up-regulated genes and blue refer to down-regulated gene. (C) PPI network analysis for these differentially expressed genes. A red dot represents an up-regulated gene and a blue dot is a down-regulated gene. (D) The miRNA-mRNA regulatory network analysis to identify crucial genes related to ESCC progression. Red colors represent up-regulated while blue colors refer to down-regulated genes. Diamond and circles represent miRNA and mRNA.

