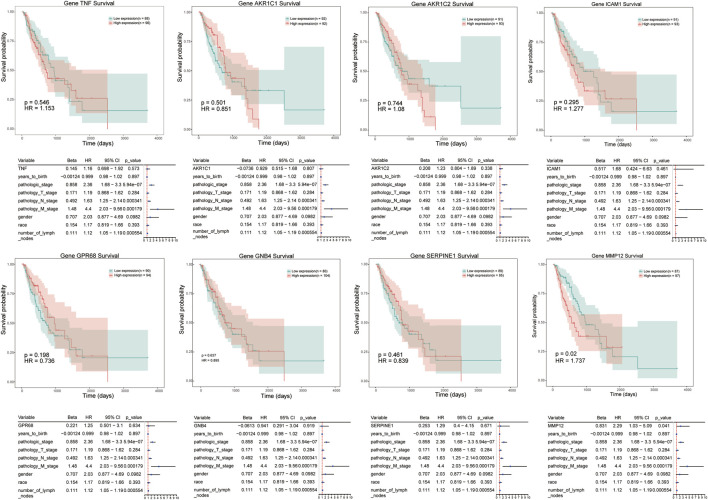
FIGURE 5.
Kaplan–Meier survival curves of candidate genes in ESCC, including TNF, AKR1C1, ICAM1, MMP12, et al. Red line represents high expression of crucial genes while green line refers to low expression genes. The X axis represent overall survival time (day), and Y axis means survival probability.

