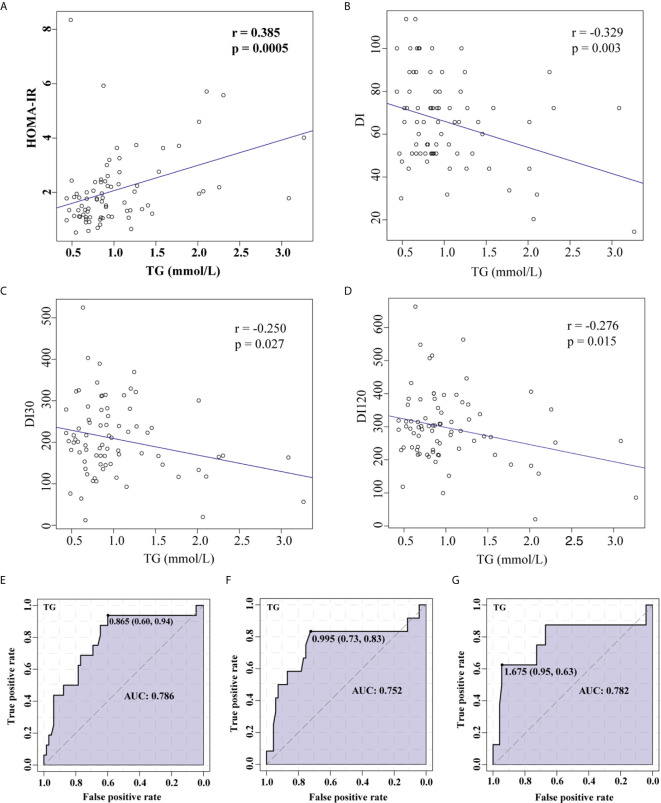
Figure 3.
Correlation between TG levels and HOMA-IR or insulin sensitivity demonstrated using Pearson’s linear correlation model and ROC curve analysis. Association between TG and HOMA-IR (A), TG and DI (B), TG and DI30 (C), and TG and DI120 (D). ROC curve analysis for TGs and HOMA-IR (E), DI (F), and DI120 (G).TG, Triglyceride; HOMA-IR, homeostasis model assessment for insulin resistance; DI, disposition index, representing adjusted insulin sensitivity according to HOMA-IR.

