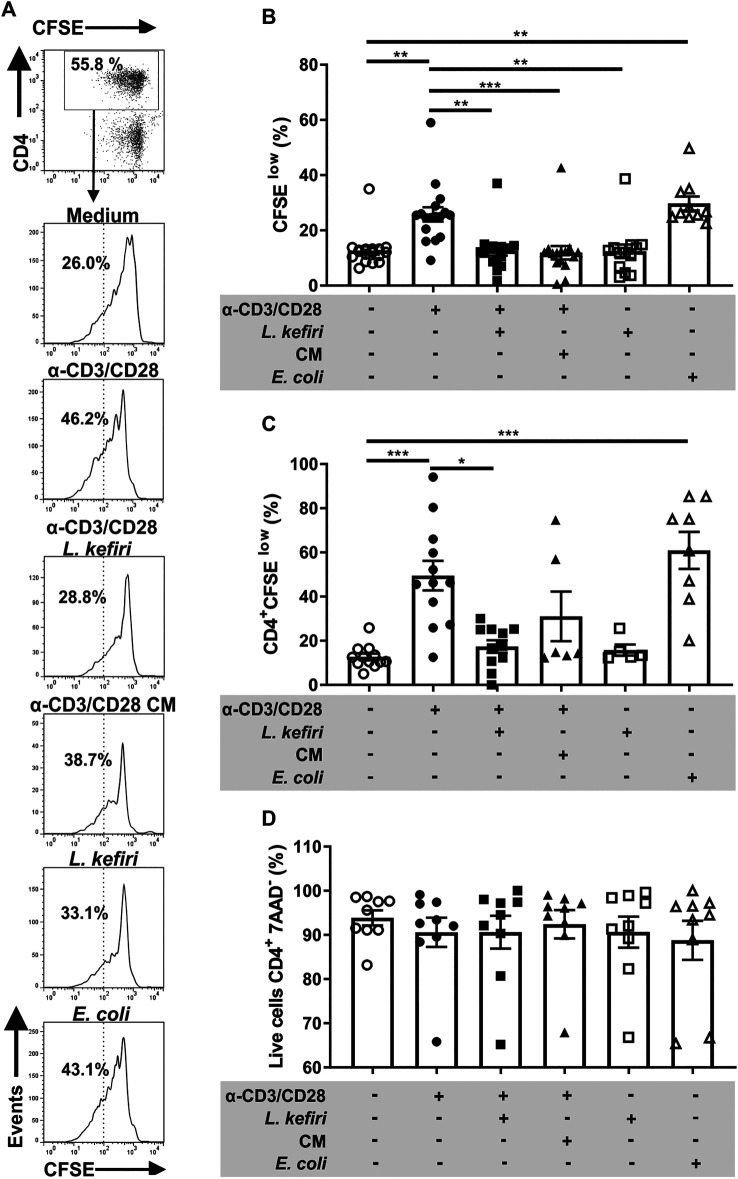
FIGURE 2.
Proliferation and LPTC response are impaired by L. kefiri (A). LPTC were activated with anti-CD3 and anti-CD28 and incubated with live probiotic, conditioned medium (CM), EA E . coli or medium. Cell proliferation was assessed by flow cytometry with CFSE. The gating strategy is shown: CD4+ cells were gated from the lymphocyte gate on the forward and side scatter plot. Histograms for CFSE staining are shown separately for each stimulus. Representative results from one patient are shown (B). LPTC proliferation shown as percentage of “CFSE low” staining population under each stimulus in vitro. Each symbol represents one independent experiment (C). Proliferation of CD4+ LPTC is shown as percentage of CFSE low cells obtained by the strategy shown in A, each symbol represents one independent experiment (D). CD4+ LPTC cell death was assessed by flow cytometry with 7-AAD staining, in the same LPTC cultures. *p < 0.05, **p < 0.01, ***p < 0.001.

