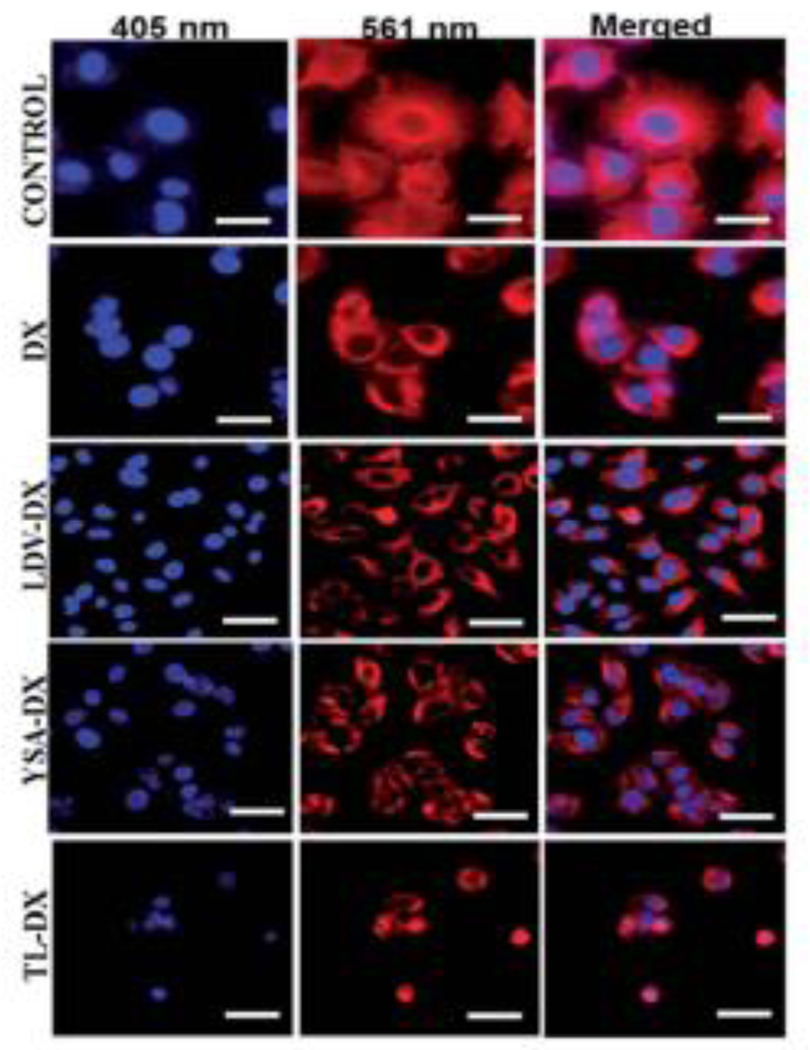
Fig. 9.
Fluorescent microscopic images of DX, LDV-DX, YSA-DX, and TL-DX on the microtubule network of A375 cell. TL-DX treatment caused higher microtubule formation and disruption. Scale bars correspond to 20 mm. (Reproduced with permission from [55]).

