
Figure 1.
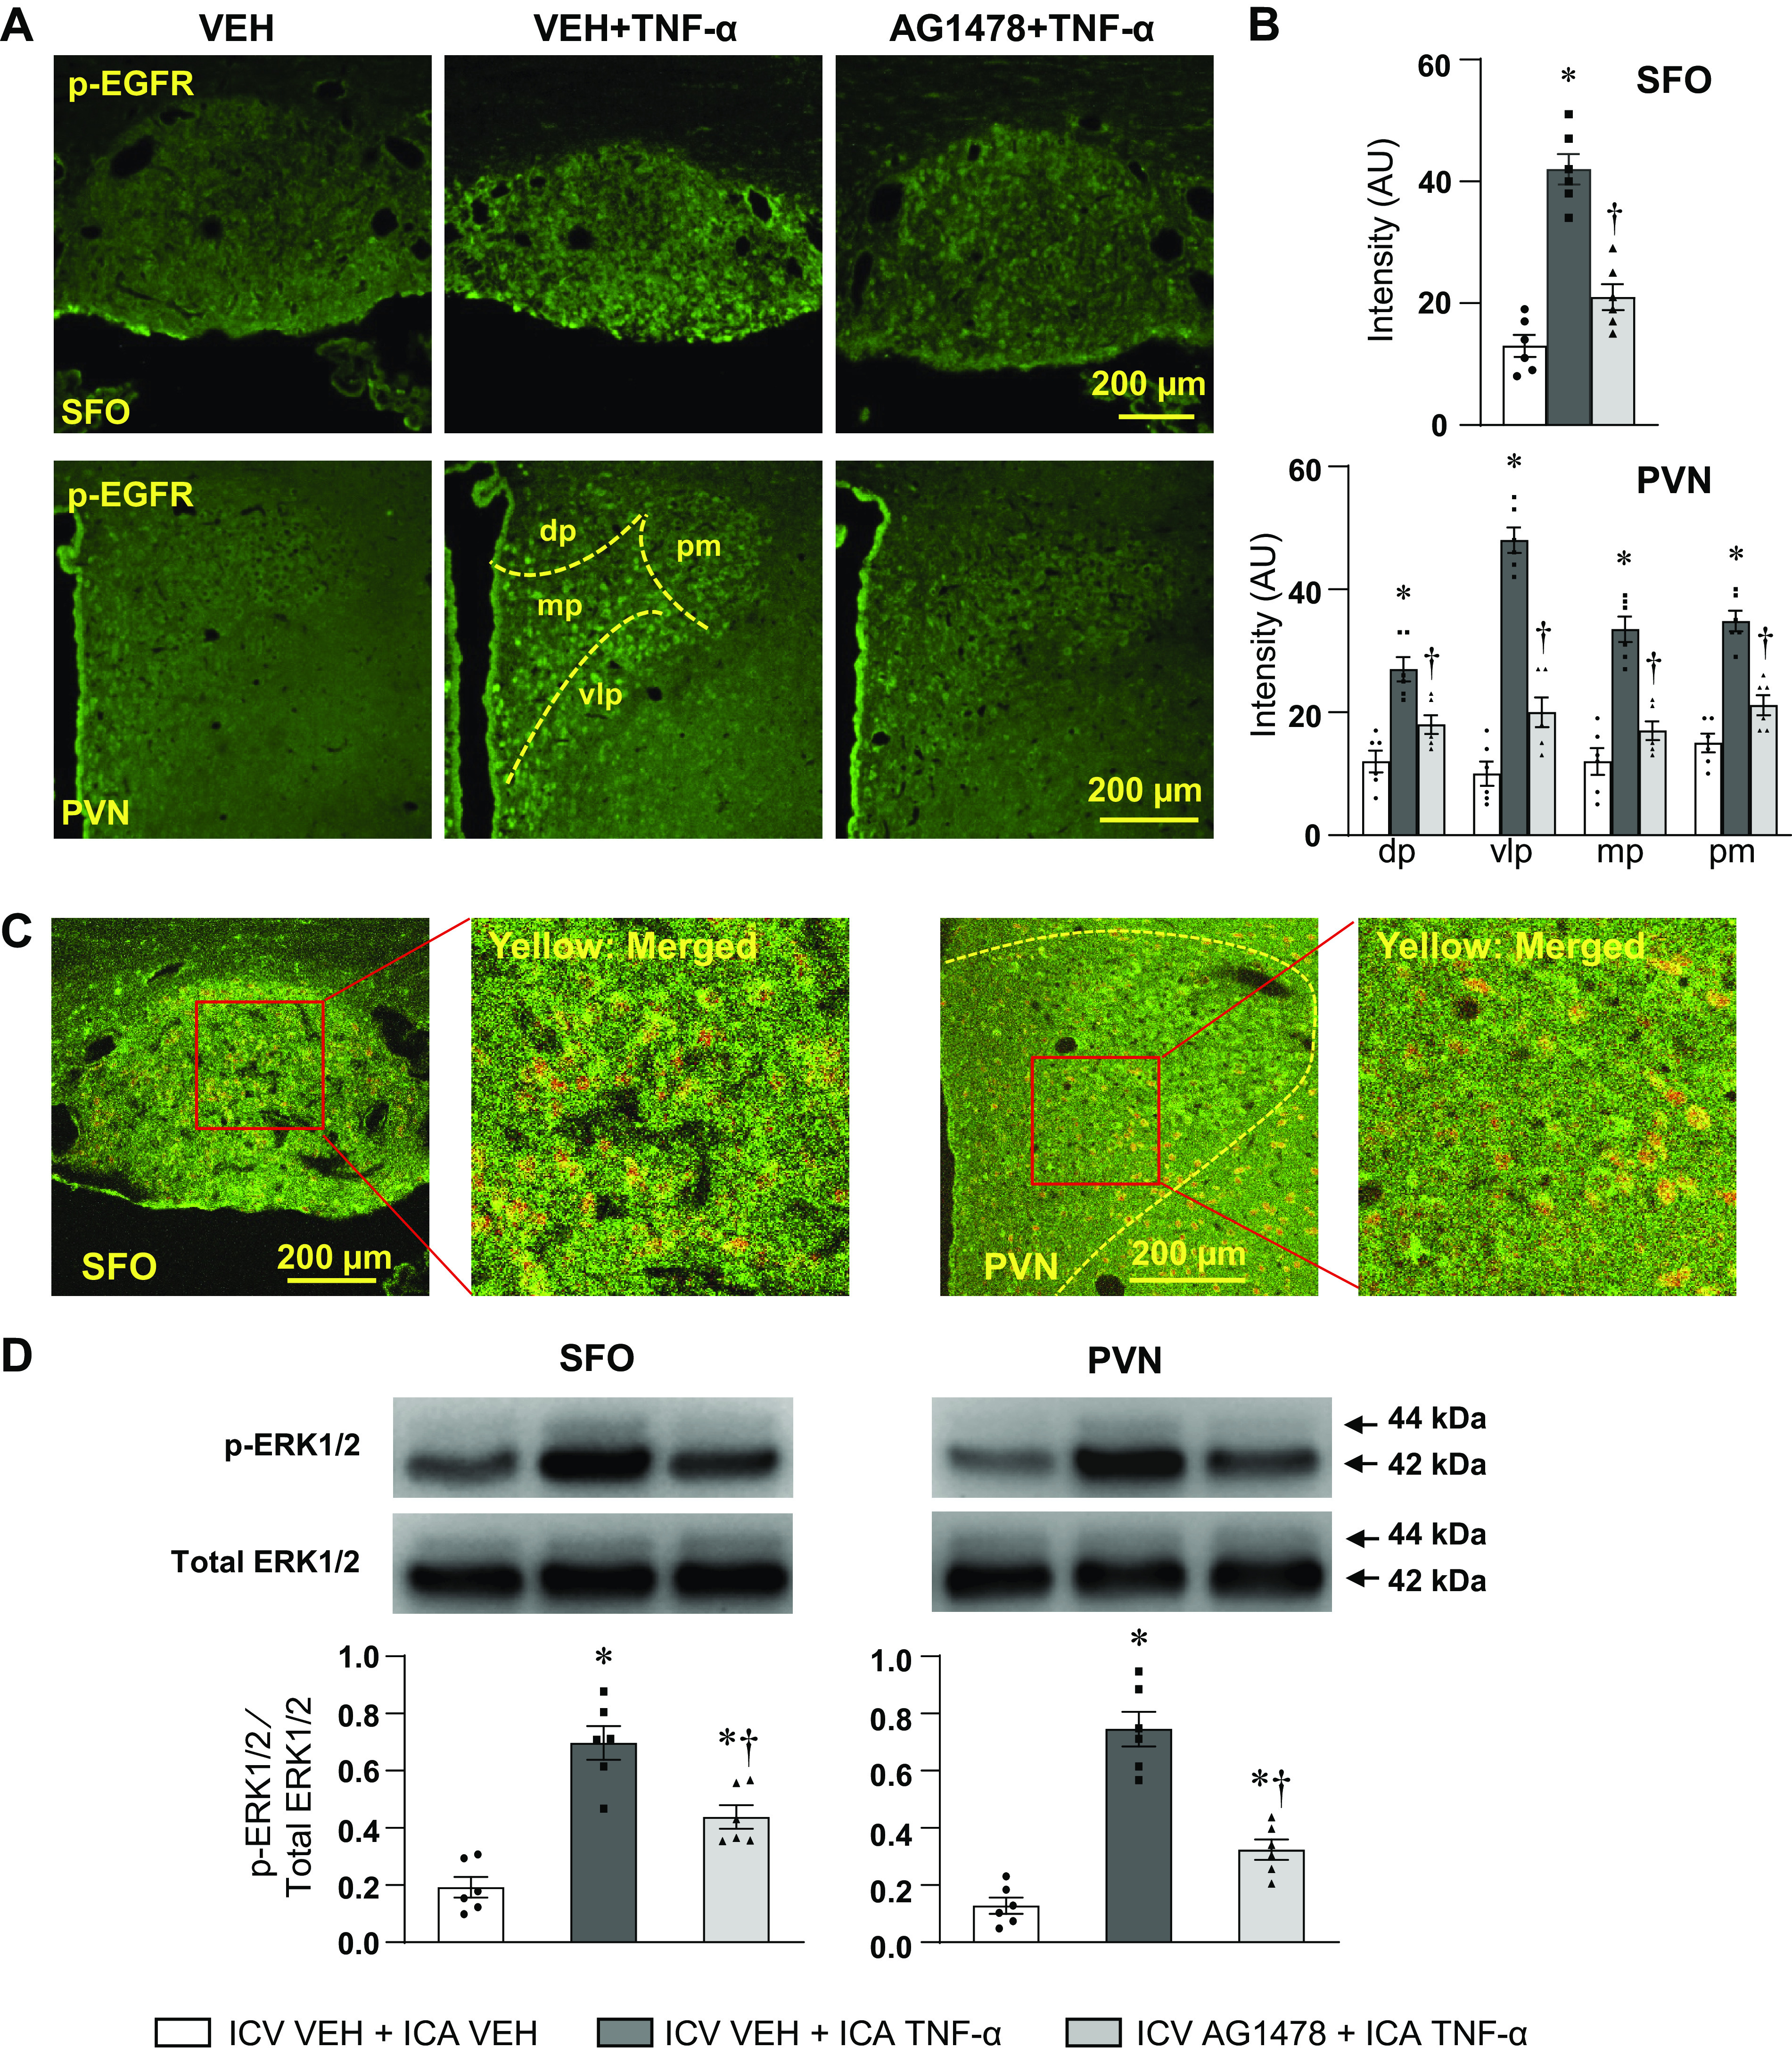
Laser confocal images (A) showing immunofluorescent staining (green) of phosphorylated-EGFR (p-EGFR) in the SFO (top) and PVN (bottom) in rats treated with ICA VEH or ICA TNF-α while receiving a continuous ICV infusion of VEH or AG1478. B: bar graphs showing the fluorescent intensity (in arbitrary units, AU) for p-EGFR in the SFO and in four subdivisions of the PVN: dp, dorsal parvocellular; mp, medial parvocellular; vlp, ventrolateral parvocellular; pm, posterior magnocellular. C: representative confocal images of the SFO (left) and PVN (right) showing the double staining of p-EGFR (green) and neuron marker NeuN (red). The merged images (yellow) show the expression of p-EGFR in neurons. D: Western blot analysis showing the protein expression of phosphorylated-ERK1/2 (p-ERK1/2) in PVN and SFO in rats treated with ICA VEH or ICA TNF-α while treated with ICV VEH or AG1478. Bar graphs show the group data and representative Western bands are shown above each bar. p-ERK1/2 is normalized to total ERK1/2. Values are expressed as mean ± SE (in B and D, n = 6 for each group). *P < 0.05, vs. ICV VEH + ICA VEH; †P < 0.05, ICV AG1478 + ICA TNF-α vs. ICV VEH + ICA TNF-α. EGFR, epidermal growth factor receptor; ICA, intracarotid artery; PVN, paraventricular nucleus; SFO, subfornical organ; VEH, vehicle.