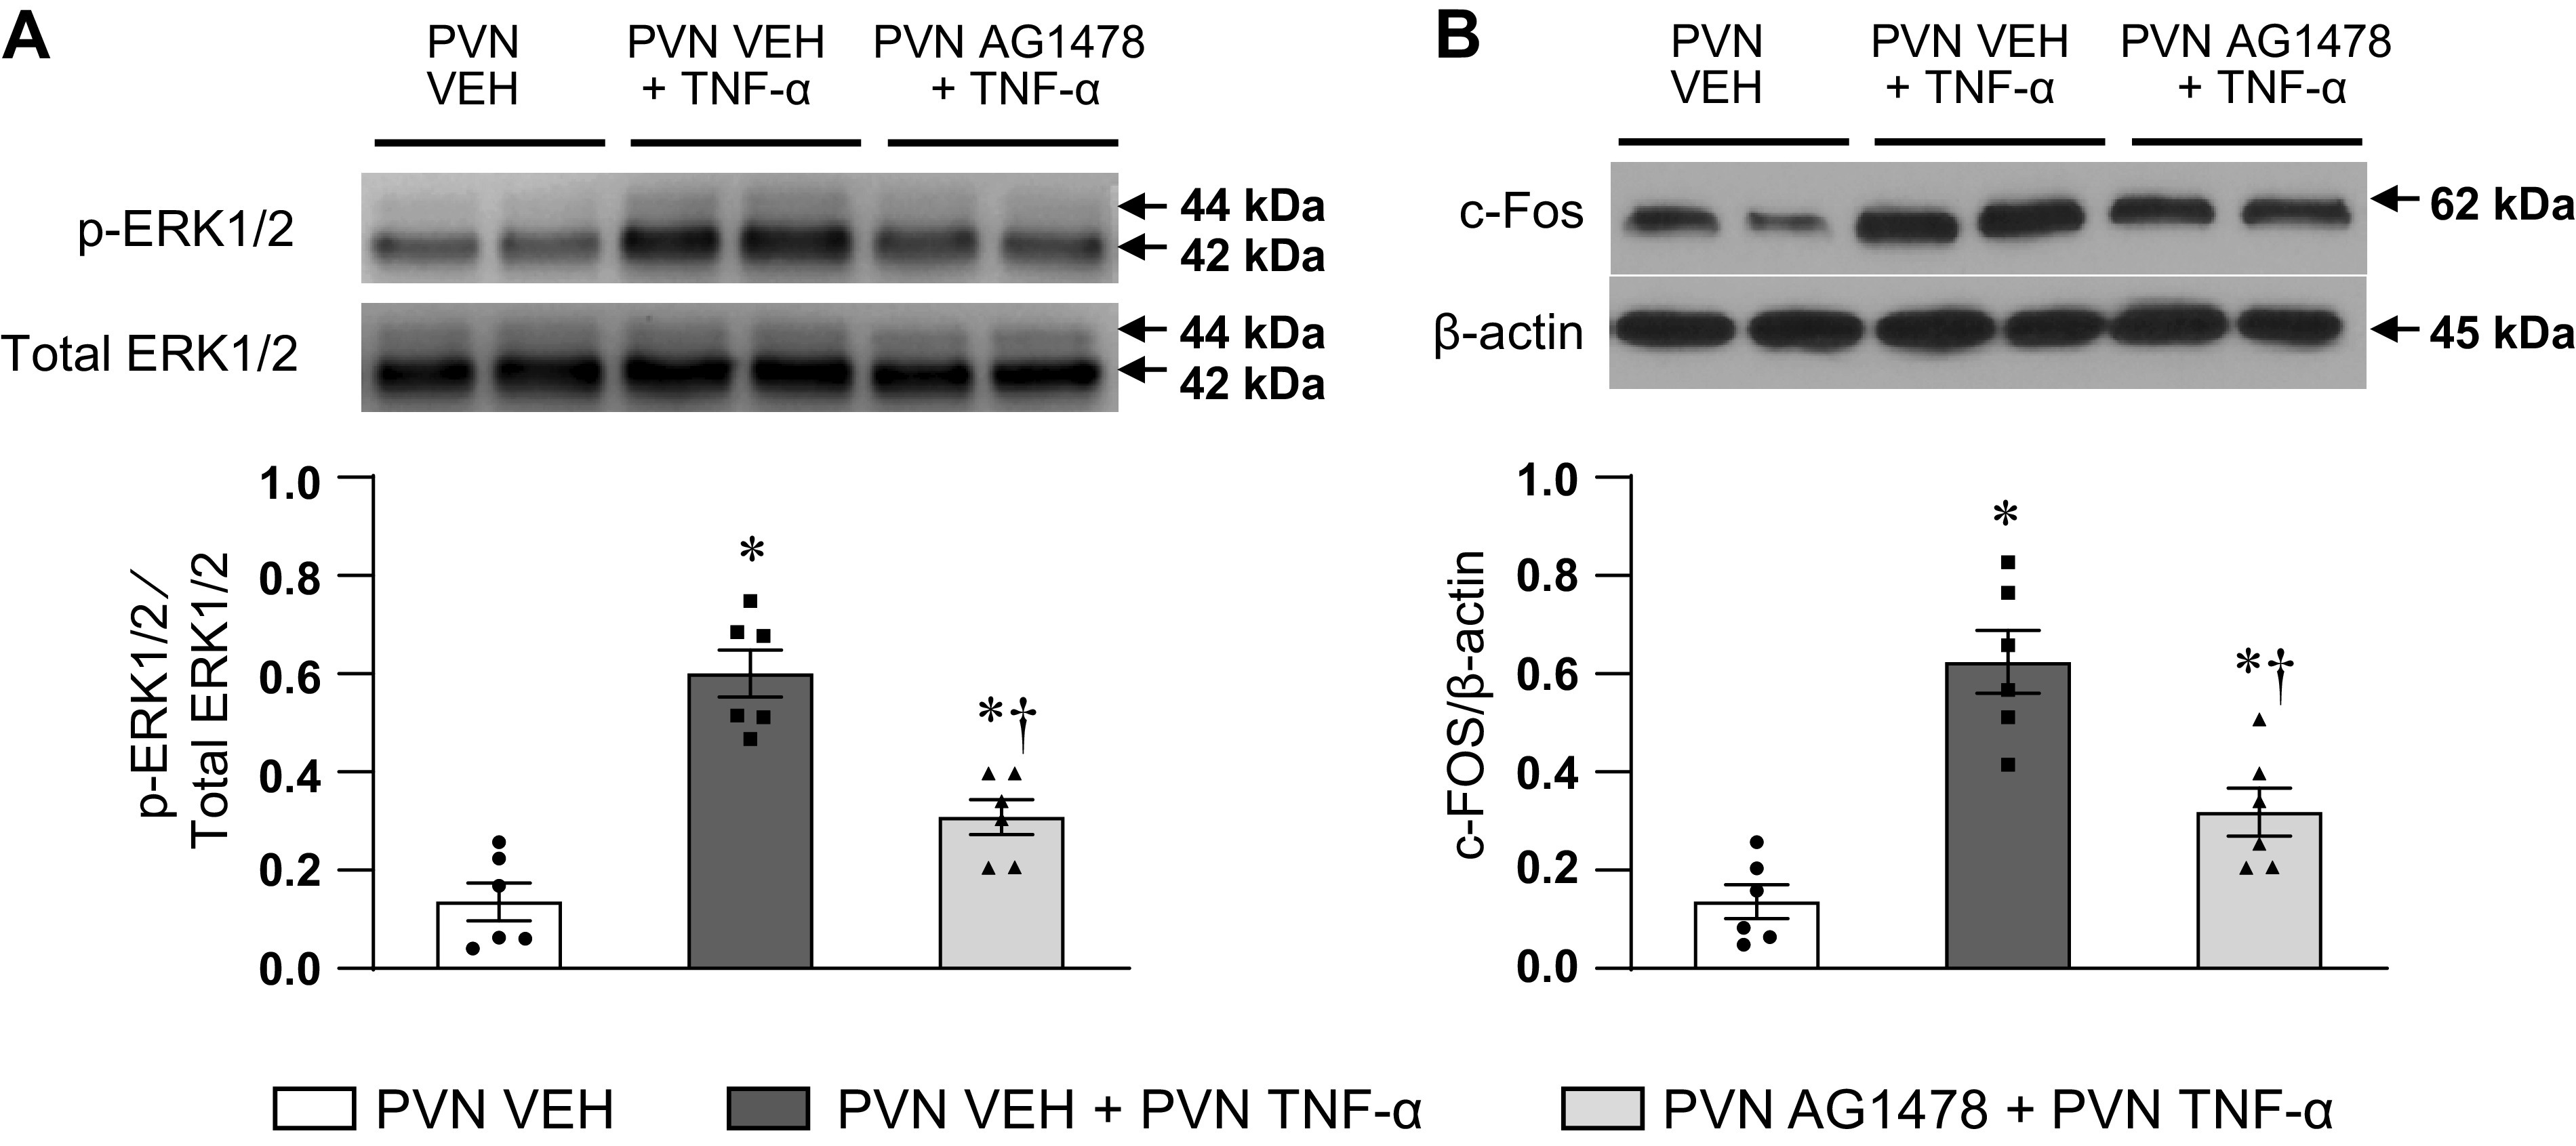
Figure 7.

Western blot analysis showing the protein expression of phosphorylated (p)-ERK1/2 (A) and c-Fos (B) in hypothalamic paraventricular nucleus (PVN) in rats treated with bilateral PVN vehicle (VEH) and PVN TNF-α after pretreatment with PVN VEH or AG1478. Bar graphs show the group data, and representative Western bands are shown above each bar. Values are expressed as means ± SE. p-ERK1/2 is normalized to total ERK1/2, and c-Fos is normalized to β-actin (n = 6 for each group). *P < 0.05, vs. PVN VEH. †P < 0.05, PVN AG1478 + PVN TNF-α vs. PVN VEH + PVN TNF-α.
