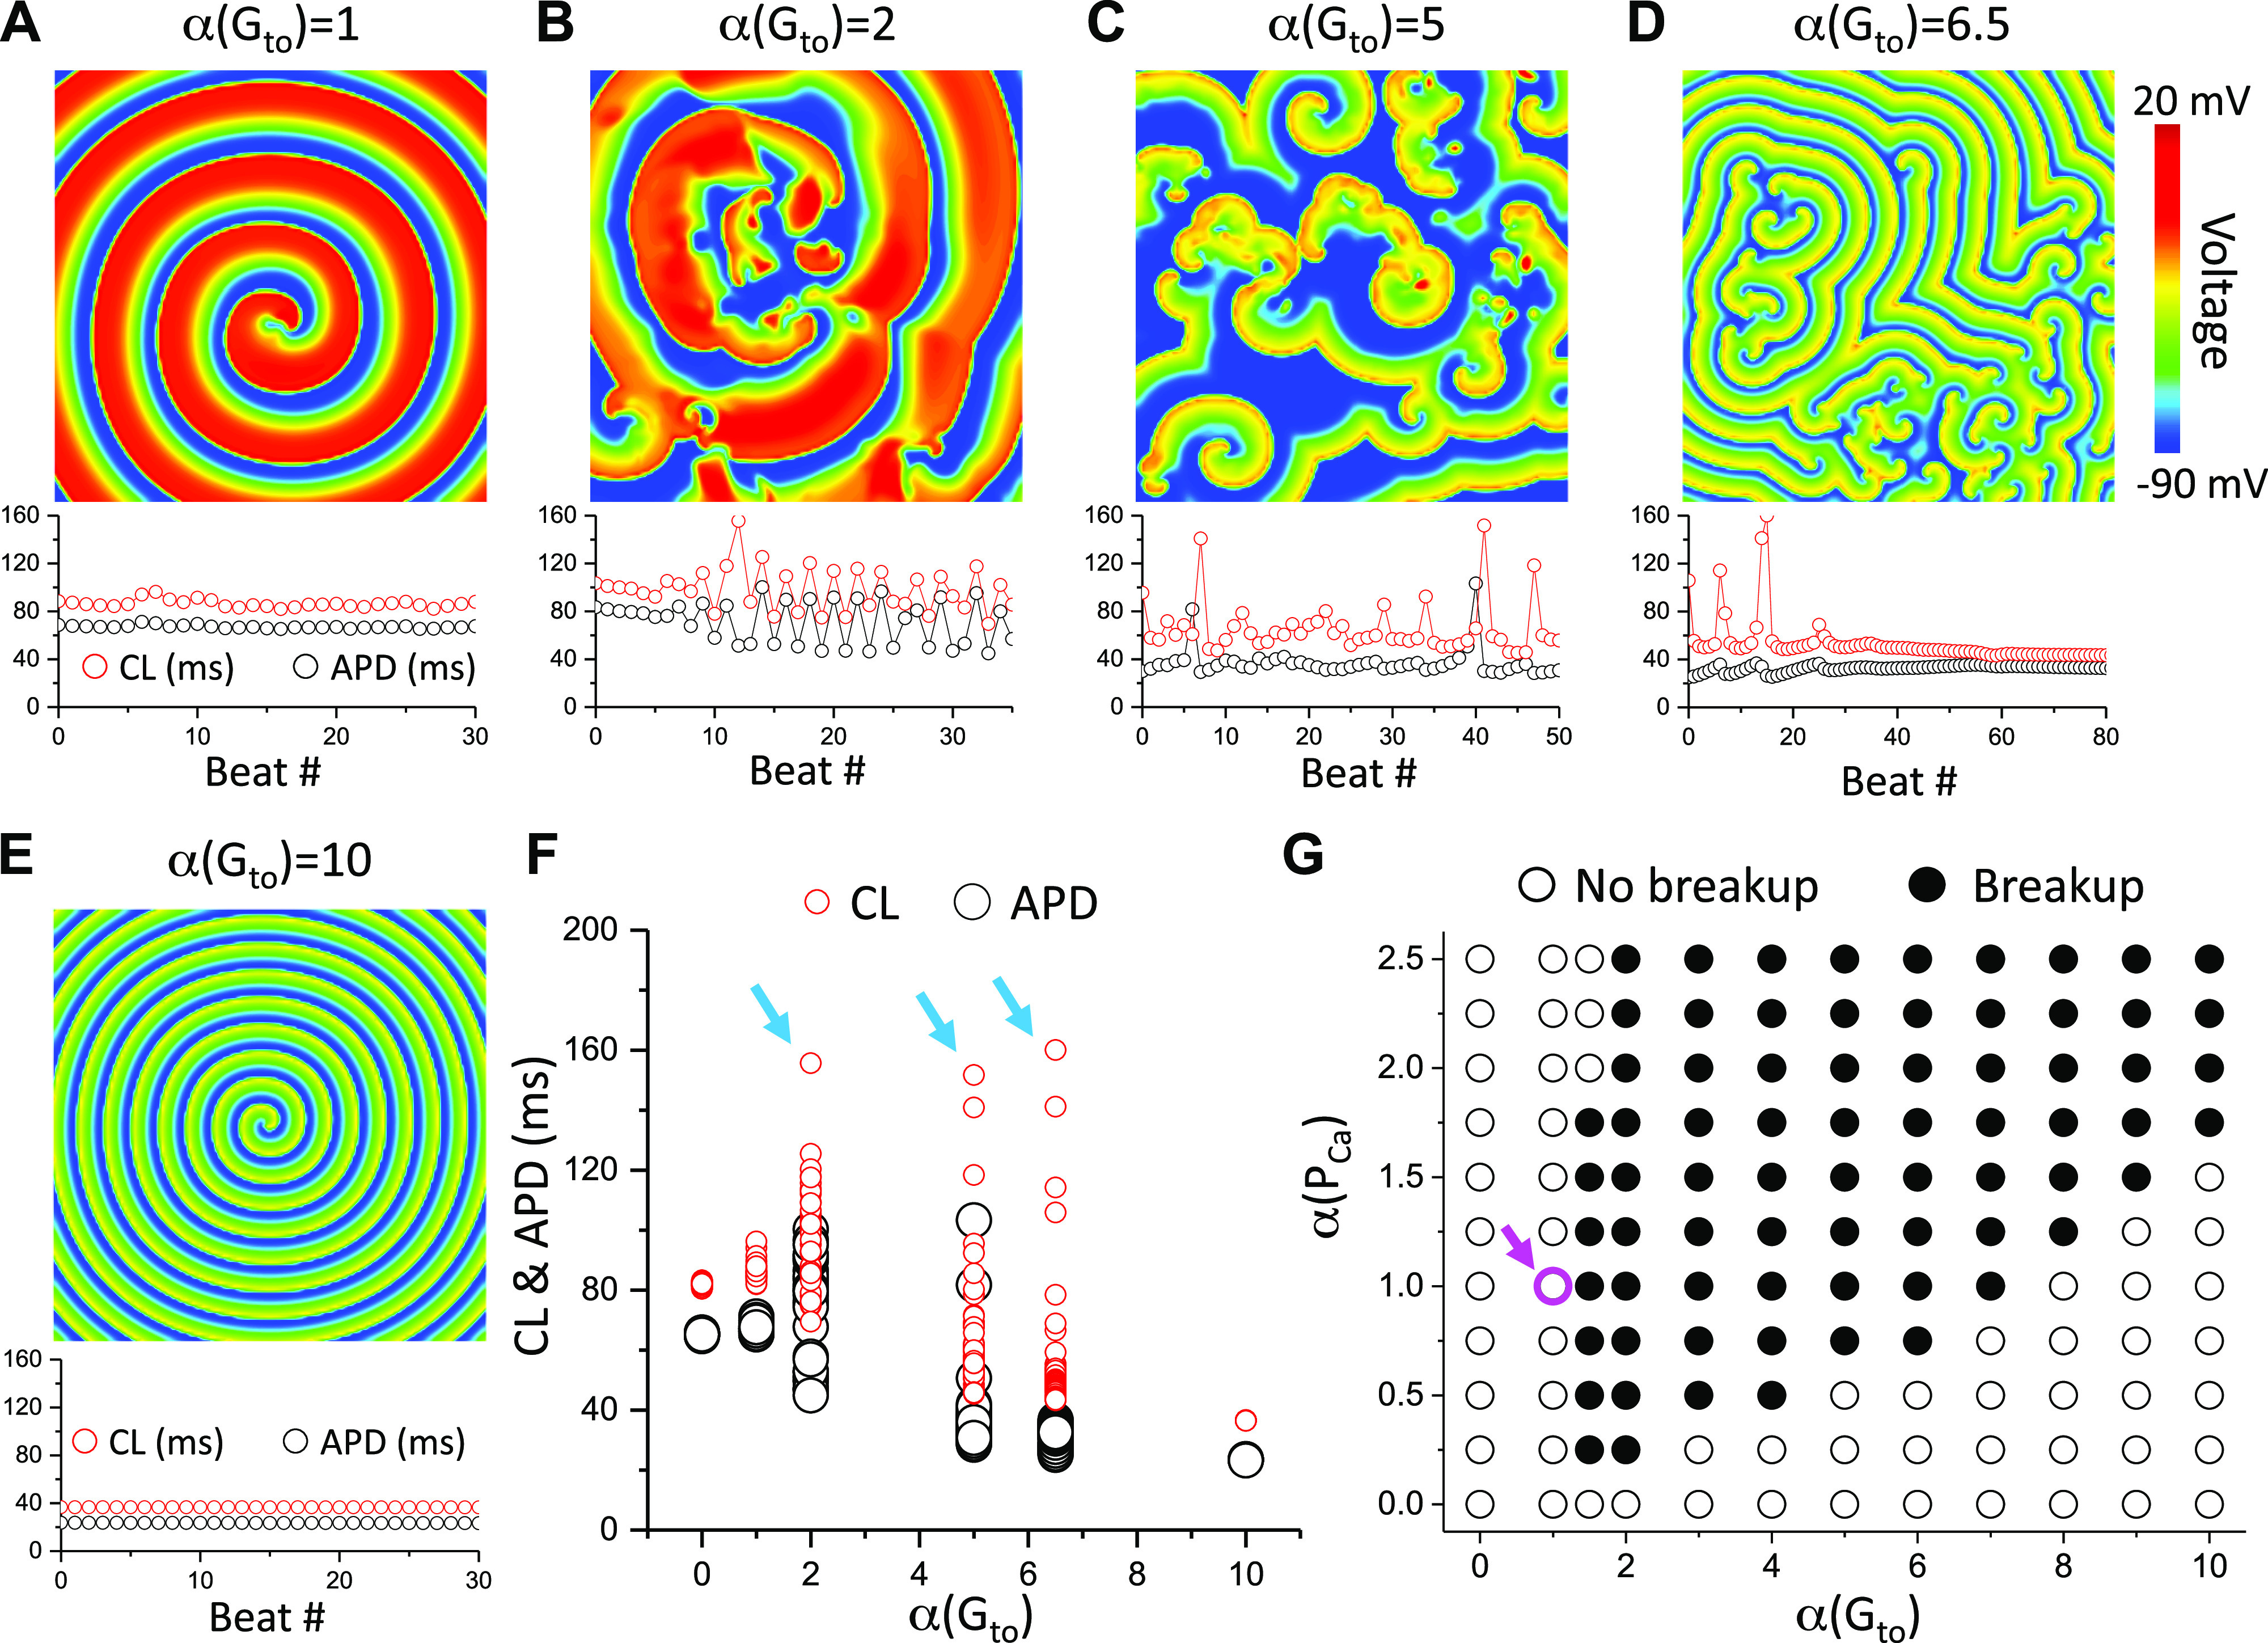
Figure 1.

Effects of the maximum Ito conductance on spiral wave breakup in two-dimensional (2-D) tissue with the 1994 Luo and Rudy (LRd) model. A–E: voltage snapshots (upper) and CL and APD vs. beat # (lower) for the original (control) LRd model (A), two times of the control Gto (B), five times of the control Gto (C), 6.5 times of the control Gto (D), and 10 times of the control Gto (E). F: APD and CL vs. α(Gto) replotted from data shown in A–E. Cyan arrows indicate the Gto with spiral wave breakup. G: spiral wave behaviors versus α(PCa) and α(Gto). The magenta circle and arrow mark the parameter set of the original LRd model (control). The control Gto is 0.5 mS/cm2.
