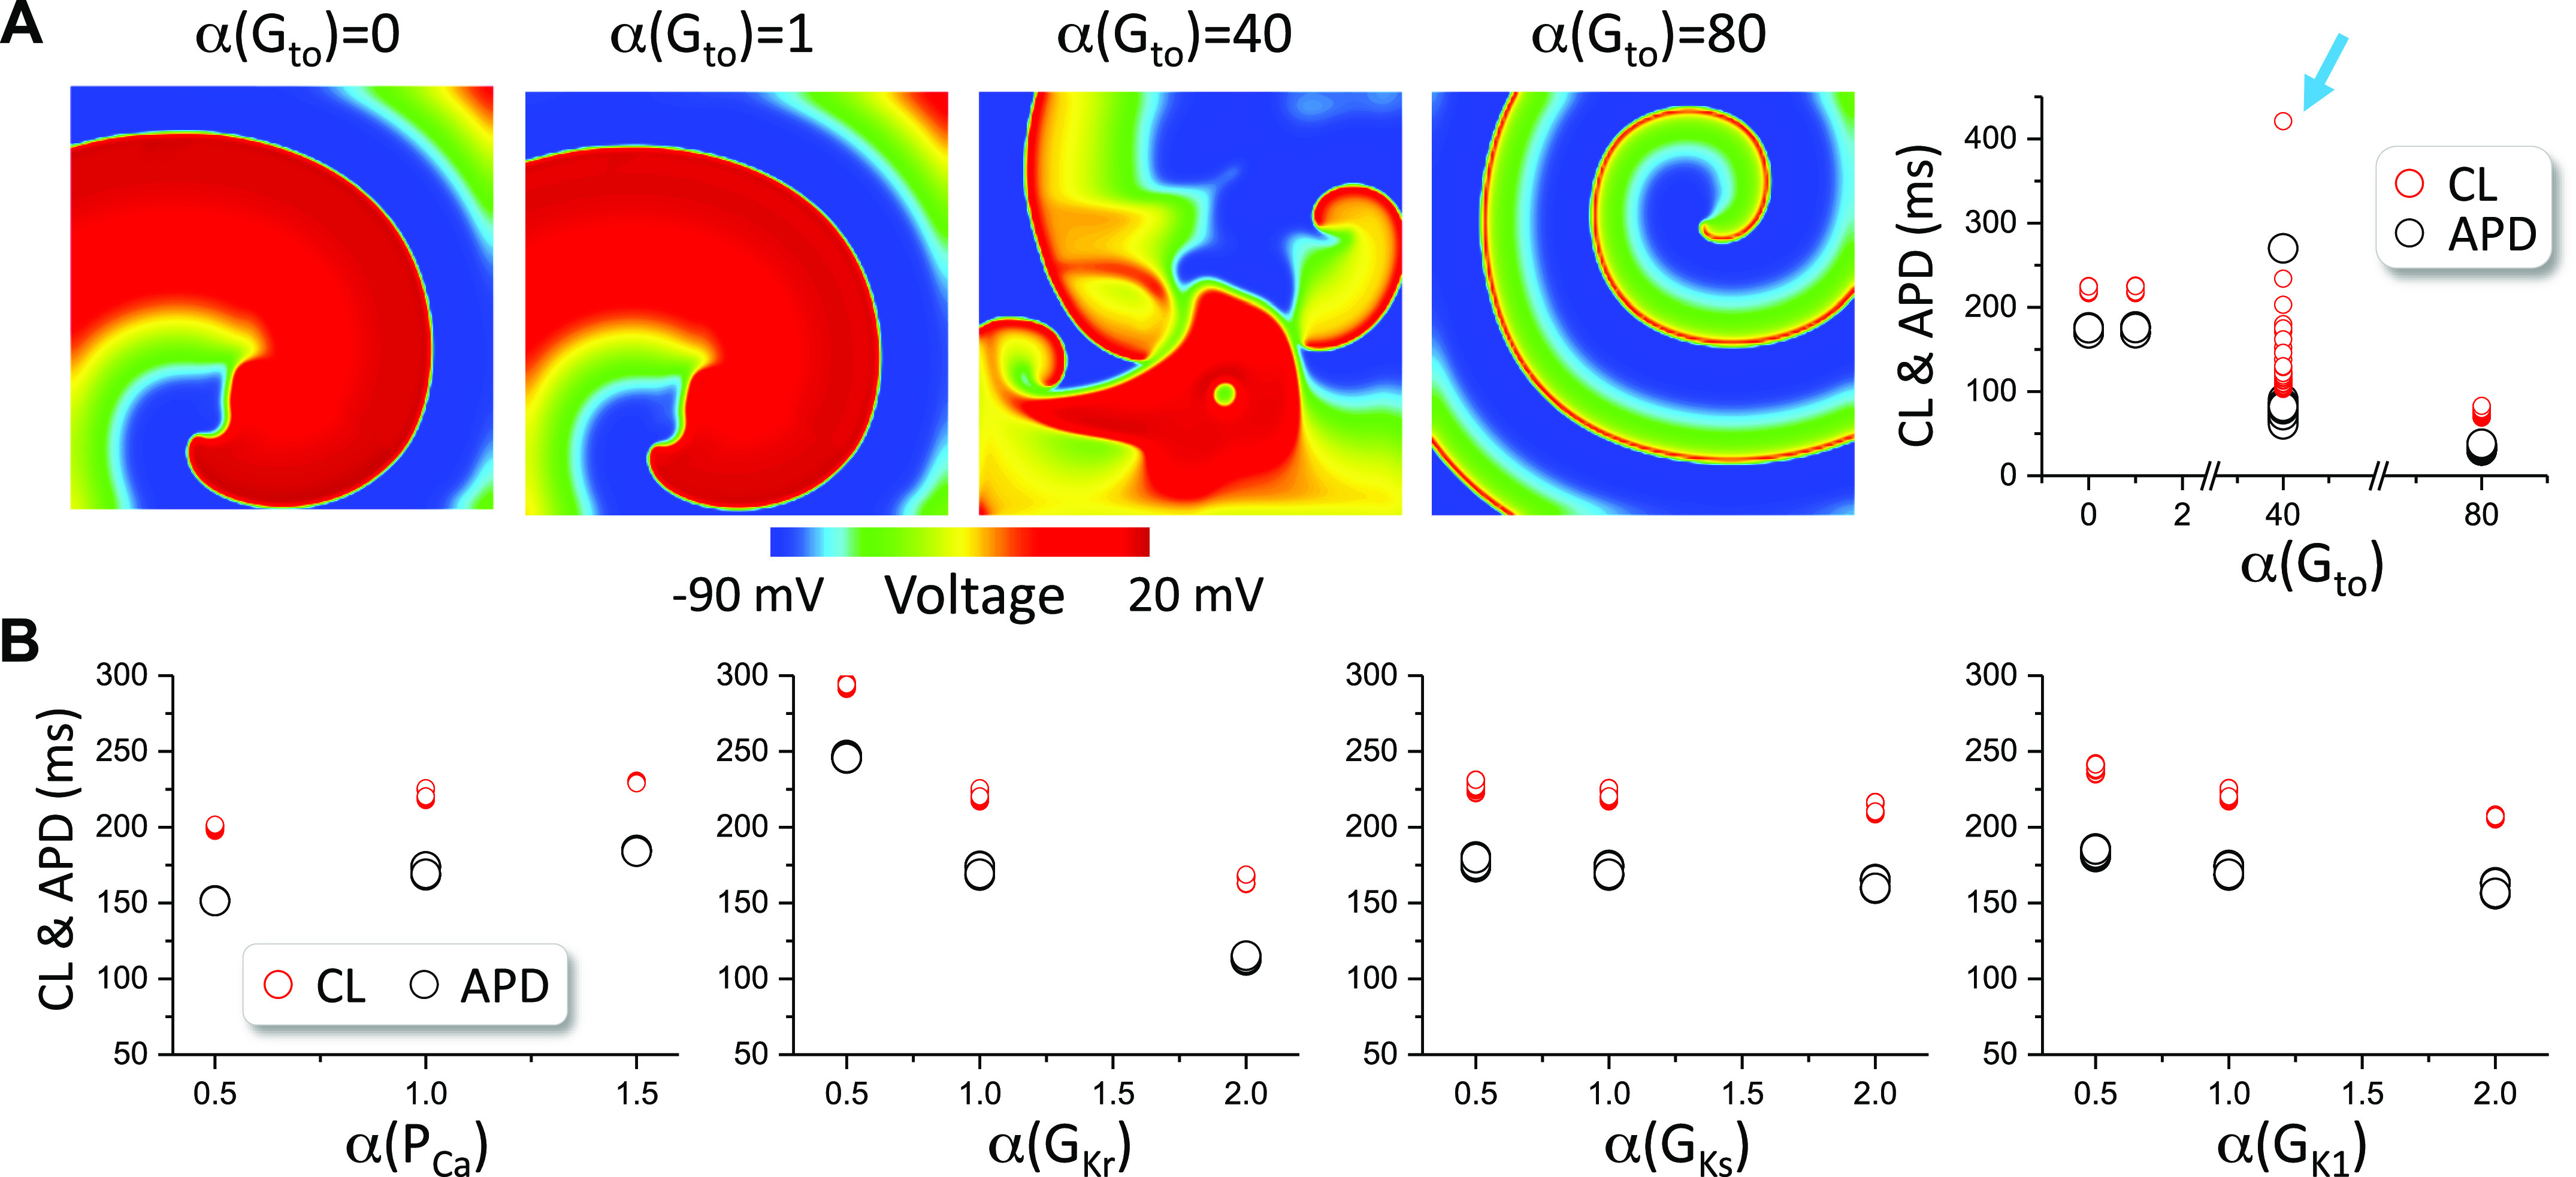
Figure 6.

Spiral wave stability in two-dimensional (2-D) tissue with the O’Hara et al. (ORd) model. A: left four panels: voltage snapshots of spiral waves at different Gto levels. Right panel: action potential duration (APD) and cycle length (CL) vs. Gto for the four Gto levels. B: APD and CL vs. the fold change (α) of the control maximum conductance of ICa,L, IKr, IKs, and IK1 in the absence of Ito (Gto = 0). Arrows indicate the cases of spiral wave breakup. The control Gto is 0.08 mS/cm2.
