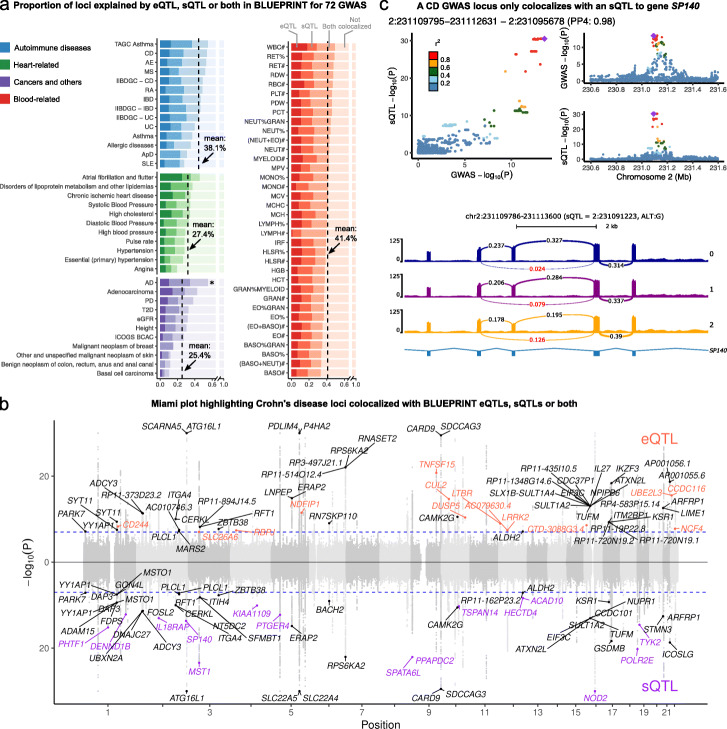
Fig. 3.
Colocalization analysis explained up to 47% of GWAS variants and revealed potential causal SNPs to non-immune traits. a Proportions of GWAS loci colocalized with eQTLs, sQTLs, or both. Dashed line: mean colocalization rate. *: Alzheimer’s disease (AD) GWAS was not included in the mean calculation owing to the well-documented involvement of microglia in AD. b Colocalization of Crohn’s Disease (CD) GWAS with eQTLs (orange), sQTLs (purple), or both (black). GWAS SNPs with -log 10(P) larger than 30 were set to 30 to facilitate visualization. c LocusCompare plot (top) and Sashimi plot (bottom) showing colocalization between a sQTL of an intron in gene SP140 in T cell and a GWAS locus for CD. Arrows in the Sashimi plot point to the intron affected by the sQTL, labeled with PSI quantification from LeafCutter [23]

