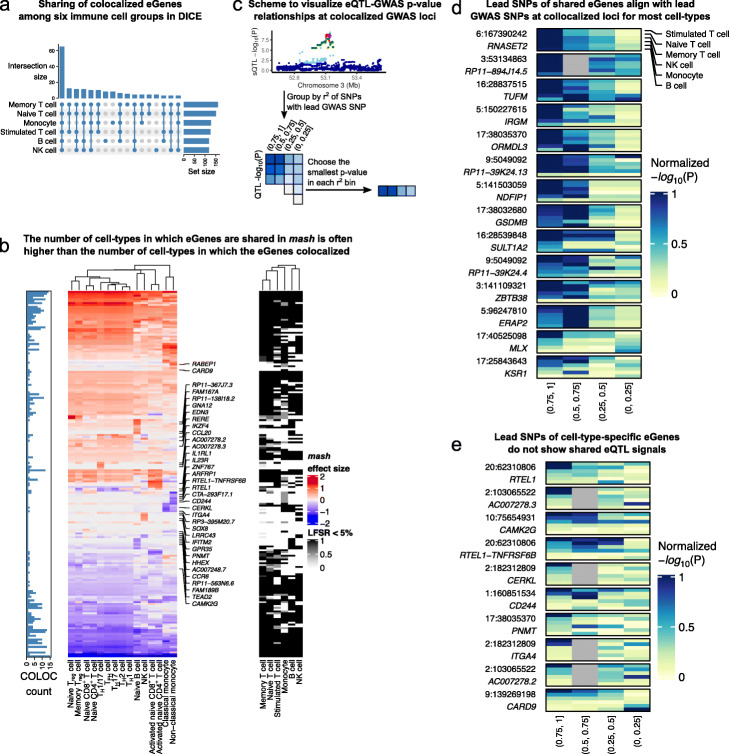
Fig. 4.
mash analysis indicates high sharing of QTLs among immune cell types. a Upset plot showing the cell-group-specificity or sharing of eGenes colocalized with immune-related GWAS loci. The majority of colocalized eGenes are shared across the 6 cell groups. b Heatmaps showing mash effect sizes of colocalized eGenes (left) and LFSR (<0.05, right). Barplot on the left shows the number of cell types in which the eGenes was determined to colocalize with a GWAS variant using COLOC. While the mash effect sizes are estimated to be shared across most immune cell types for most GWAS loci, the colocalization status as determined using COLOC (PP4 >0.75) often imply cell type-specificity. c Schematic representation of our approach to visualize the QTL association P value distribution of colocalized eGenes across SNPs with different amount of LD with the lead GWAS SNP. If a QTL in a cell type colocalizes with a GWAS loci, then in general the significance of the QTL association should decrease for SNPs with decreasing amount of LD with the lead GWAS SNP. d eQTL p values in different LD bins (as described in c) at GWAS loci with colocalized eQTLs across all 6 cell groups. Colocalized eGenes that were inferred to be shared all have lower eQTL p values at SNPs in high LD with the lead GWAS SNPs. e By contrast, colocalized eGenes that were inferred to be cell type-specific show different patterns of eQTL p value distribution in the LD bins

