Fig. 5.
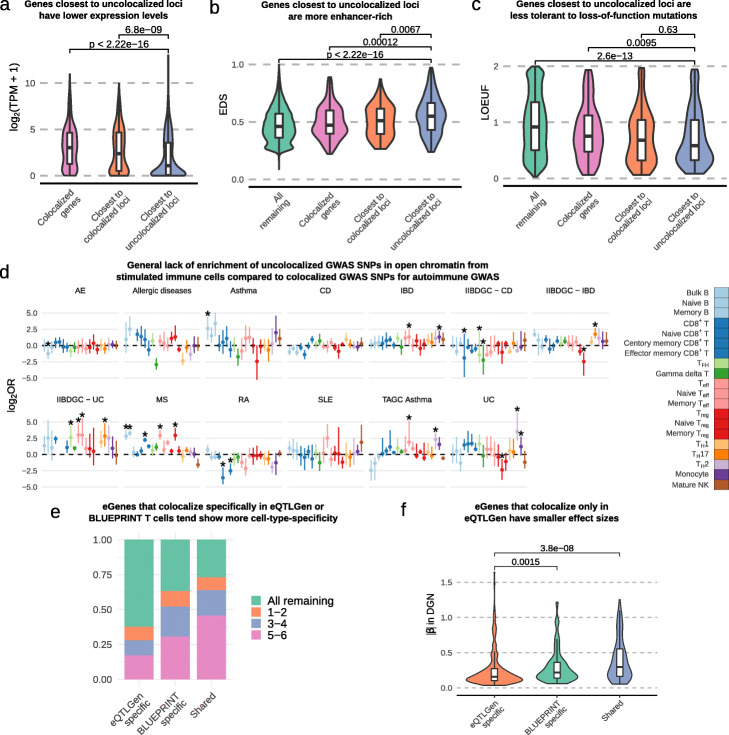
Characterizations of uncolocalized GWAS loci. a Genes closest to uncolocalized loci are expressed at lower levels compared to colocalized eGenes. b Genes closest to uncolocalized loci have higher EDS, indicating their expression is more constrained. c Genes closest to uncolocalized loci have lower LOEUF [40], suggesting that they are less tolerant to rare mutations. d Forest plot showing the log2 odds ratios of the enrichment of uncolocalized GWAS SNPs in open chromatin of stimulated immune cells compared to colocalized GWAS SNPs (Fisher’s exact test). Few stimulated immune cell types are enriched for uncolocalized autoimmune GWAS loci. Error bars show 95% confidence intervals from bootstrap (Methods); *: FDR <0.05. e eGenes that colocalized only in eQTLGen data tend to be restricted in fewer cell types (in DICE data) compared to eGenes that colocalized only in BLUEPRINT data or eGenes that colocalized in both BLUEPRINT and eQTLGen. f eGenes that colocalize only in eQTLGen data have smaller effect sizes compared to eGenes that colocalize only in BLUEPRINT T cells or eGenes that are shared between eQTLGen and BLUEPRINT. To reduce the Winner’s curse effect, the effect sizes were ascertained using the DGN dataset

