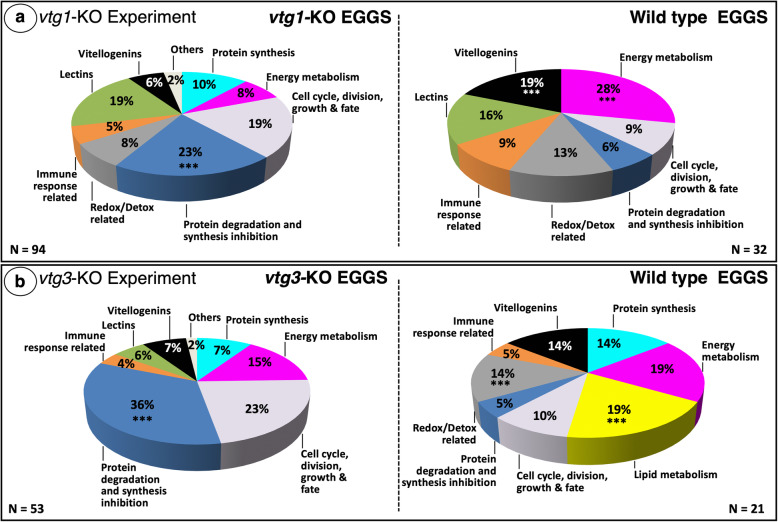
Fig. 1.
Distribution of differentially regulated proteins among functional categories. Panel a. vtg1-KO Experiment. Panel b. vtg3-KO Experiment. Only proteins that were identified in > 4 biological samples and that exhibited a > 1.5-fold difference in N-SC between groups (vtg-KO versus Wt), or proteins unique to a certain group, were included in this analysis. In both experiments, the overall distribution of differentially regulated proteins among the functional categories significantly differed between KO and Wt eggs (χ2, p < 0.05). Asterisks indicate significant differences between different groups in the proportion of differentially regulated proteins within a functional category (χ2, p < 0.05). The corresponding Ensembl Protein IDs and associated gene, transcript and protein names, functional categories (shown above), regulation (compared to Wt) (unique, up-regulated in KO or down-regulated in KO), and fold-difference in N-SC between KO and Wt eggs for proteins included in this analysis for the vtg1-KO and vtg3-KO experiments are given in Tables S1 and S2, respectively

