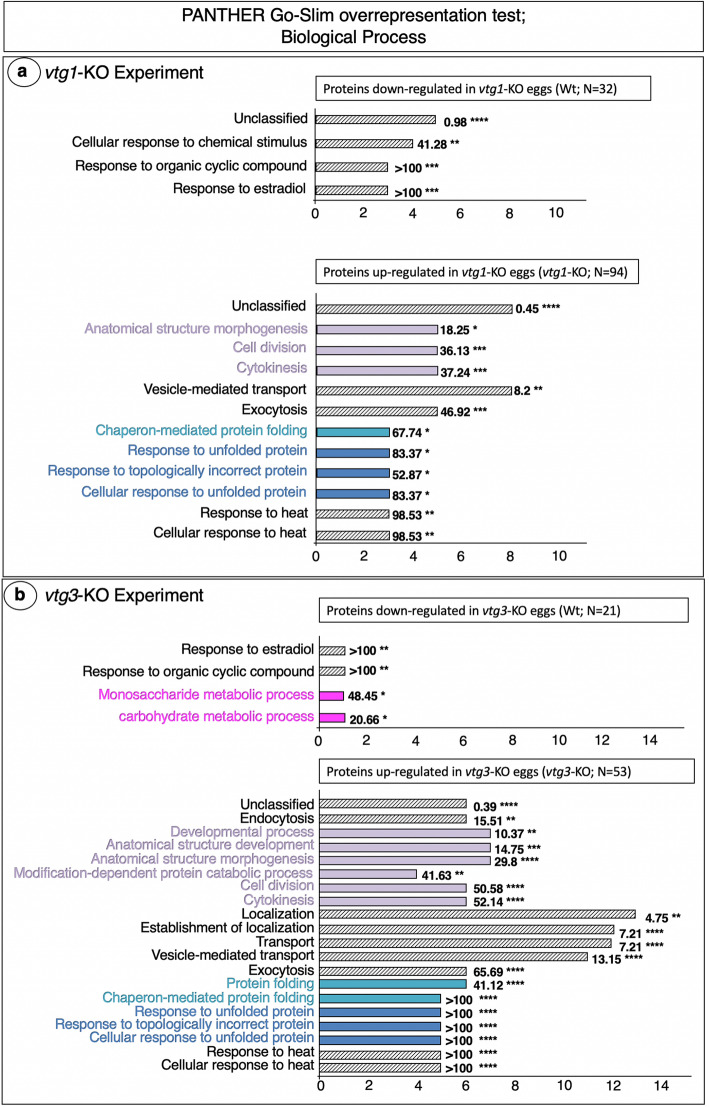
Fig. 2.
PANTHER GO Biological Processes found to be overrepresented by differentially regulated proteins. Panel a. vtg1-KO Experiment. Panel b. vtg3-KO Experiment. Only proteins that were identified in > 4 biological samples and that exhibited a > 1.5-fold difference in N-SC between groups (vtg1-KO versus Wt), or proteins unique to a certain group, were included in this analysis. Horizontal bars indicate the number of proteins attributed to each GO term for which statistically significant results (Fisher’s Exact test, p < 0.05, followed by Bonferroni correction for multiple testing (p < 0.05)) were observed (Results shown for Wt egg proteins in Fig. 2b. Top Panel based on FDR only, no Bonferroni correction was applied). Numbers next to the bars indicate the fold-enrichment with proteins attributed to each term and the number of asterisks indicates the significance level of the enrichment, as follows p < 0.05 (*), p < 0.01 (**), p < 0.001 (***), and p < 0.0001 (****). Where possible, horizontal bars are colored to indicate corresponding protein functional categories shown in Fig. 1; cell cycle, division, growth and fate (lavender), protein synthesis (light blue), protein degradation and synthesis inhibition (dark blue), energy metabolism (magenta)

