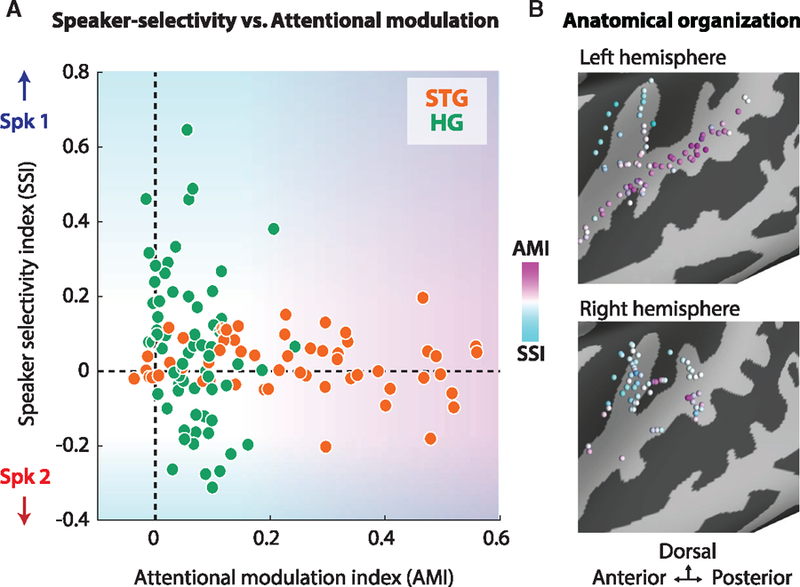
Figure 4. Speaker-Selectivity Index versus Attention-Modulation Index (AMI).

(A) The joint distribution of the AMI (x axis) and SSI (y axis) in HG (green) and STG (orange). This distribution further illustrates that HG shows the small effect of attention and a large amount of speaker selectivity. Conversely, STG exhibits a large effect of attention and little speaker selectivity.
(B) The anatomical distribution of the SSI (cyan) and AMI (magenta). These plots illustrate a fundamental difference between the nature of the representation in HG and STG where HG provides a feature-rich, relatively static representation of the speakers, whereas STG filters out the unwanted source and selectively represents the attended speaker.
