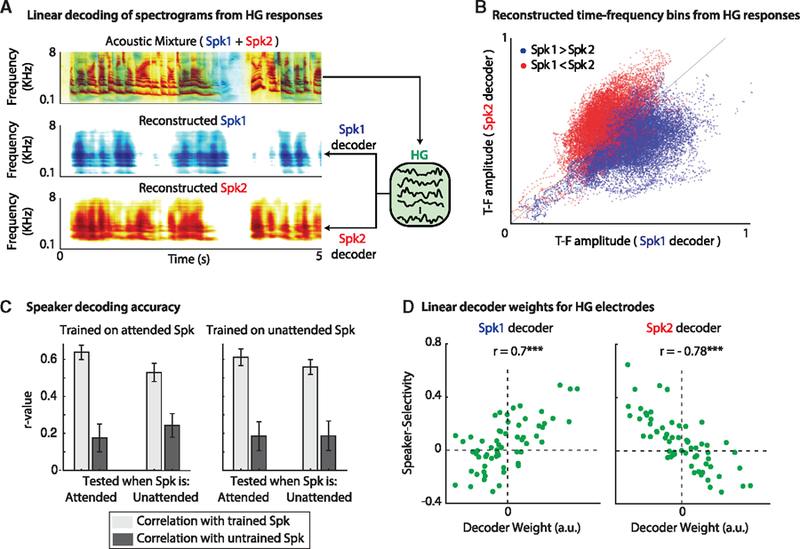
Figure 6. Speakers Are Linearly Separable in HG.

(A) Training linear decoders to extract either speaker from the representation of the mixture in HG. Top panel: the spectrogram of the mixture (displayed as the superposition of Spk1 and Spk2). Linear decoders can reconstruct either Spk1 (middle) or Spk2 (bottom) from the neural responses in HG to the mixture.
(B) Scatterplot of the amplitude of all time-frequency (TF) bins when reconstructing Spk1 (x axis) versus reconstructing Spk2 (y axis). The dots are colored according to the dominant speaker in the corresponding T-F bin.
(C) Irrespective of the actual attended speaker, both speakers can be extracted from the representation of the mixture in HG. Left panel: decoders were trained on the attended speaker and tested when that speaker was either attended or ignored (see x labels). Right panel: decoders were trained on the ignored (unattended) speaker and tested when that speaker was either attended or ignored (see x labels). Light gray bars indicate the correlation (mean ± STD) with the trained speaker, and dark gray bars indicate the correlation with the untrained speaker. In all cases, the reconstruction has a significantly higher correlation (p < 0.001) with the trained speaker than with the untrained speaker.
(D) The SSI for each electrode in HG (green dots) is plotted against the average weight that the decoders learn to apply to them when the decoders are tasked with extracting Spk1 (left panel) or Spk2 (right panel). The decoders learn to enhance/suppress the electrodes that are selective for Spk1/Spk2 depending on the speaker to be extracted.
