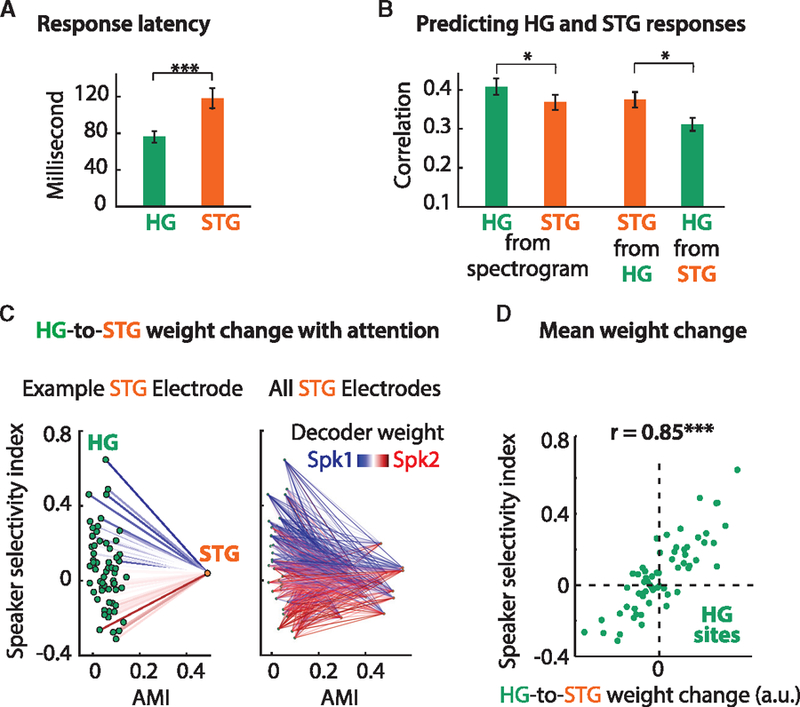
Figure 7. Mapping HG to STG.

(A) STG (orange) responds with a longer latency than HG (green), suggesting that STG is further downstream (cf. Figure 3D).
(B) The neural responses in HG and STG can be predicted from the acoustic spectrogram (using a STRF) or from each other. Both areas can be predicted from the stimulus (left panel), with HG having significantly higher (p < 0.05) prediction accuracies. However, when mapping from HG to STG (and vice versa), HG can predict STG significantly better than STG can predict HG (p < 0.05). Error bars denote the mean SE. Data are from the singletalker condition.
(C) Mapping HG to STG in the multi-talker condition. Left panel: for an example electrode in STG (orange dot), under attention, the weights from each HG electrode (green dots) change to enhance (suppress) the attended (unattended) speaker. Blue (red) lines correspond to a larger weight when Spk1 (Spk2) is attended.
(D) The average weight change for each HG electrode (green dots) plotted against their corresponding SSI. The positive correlation (r = 0.85) confirms that larger weight changes are applied to the most speaker-selective sites in HG.
