
Fig. A3.
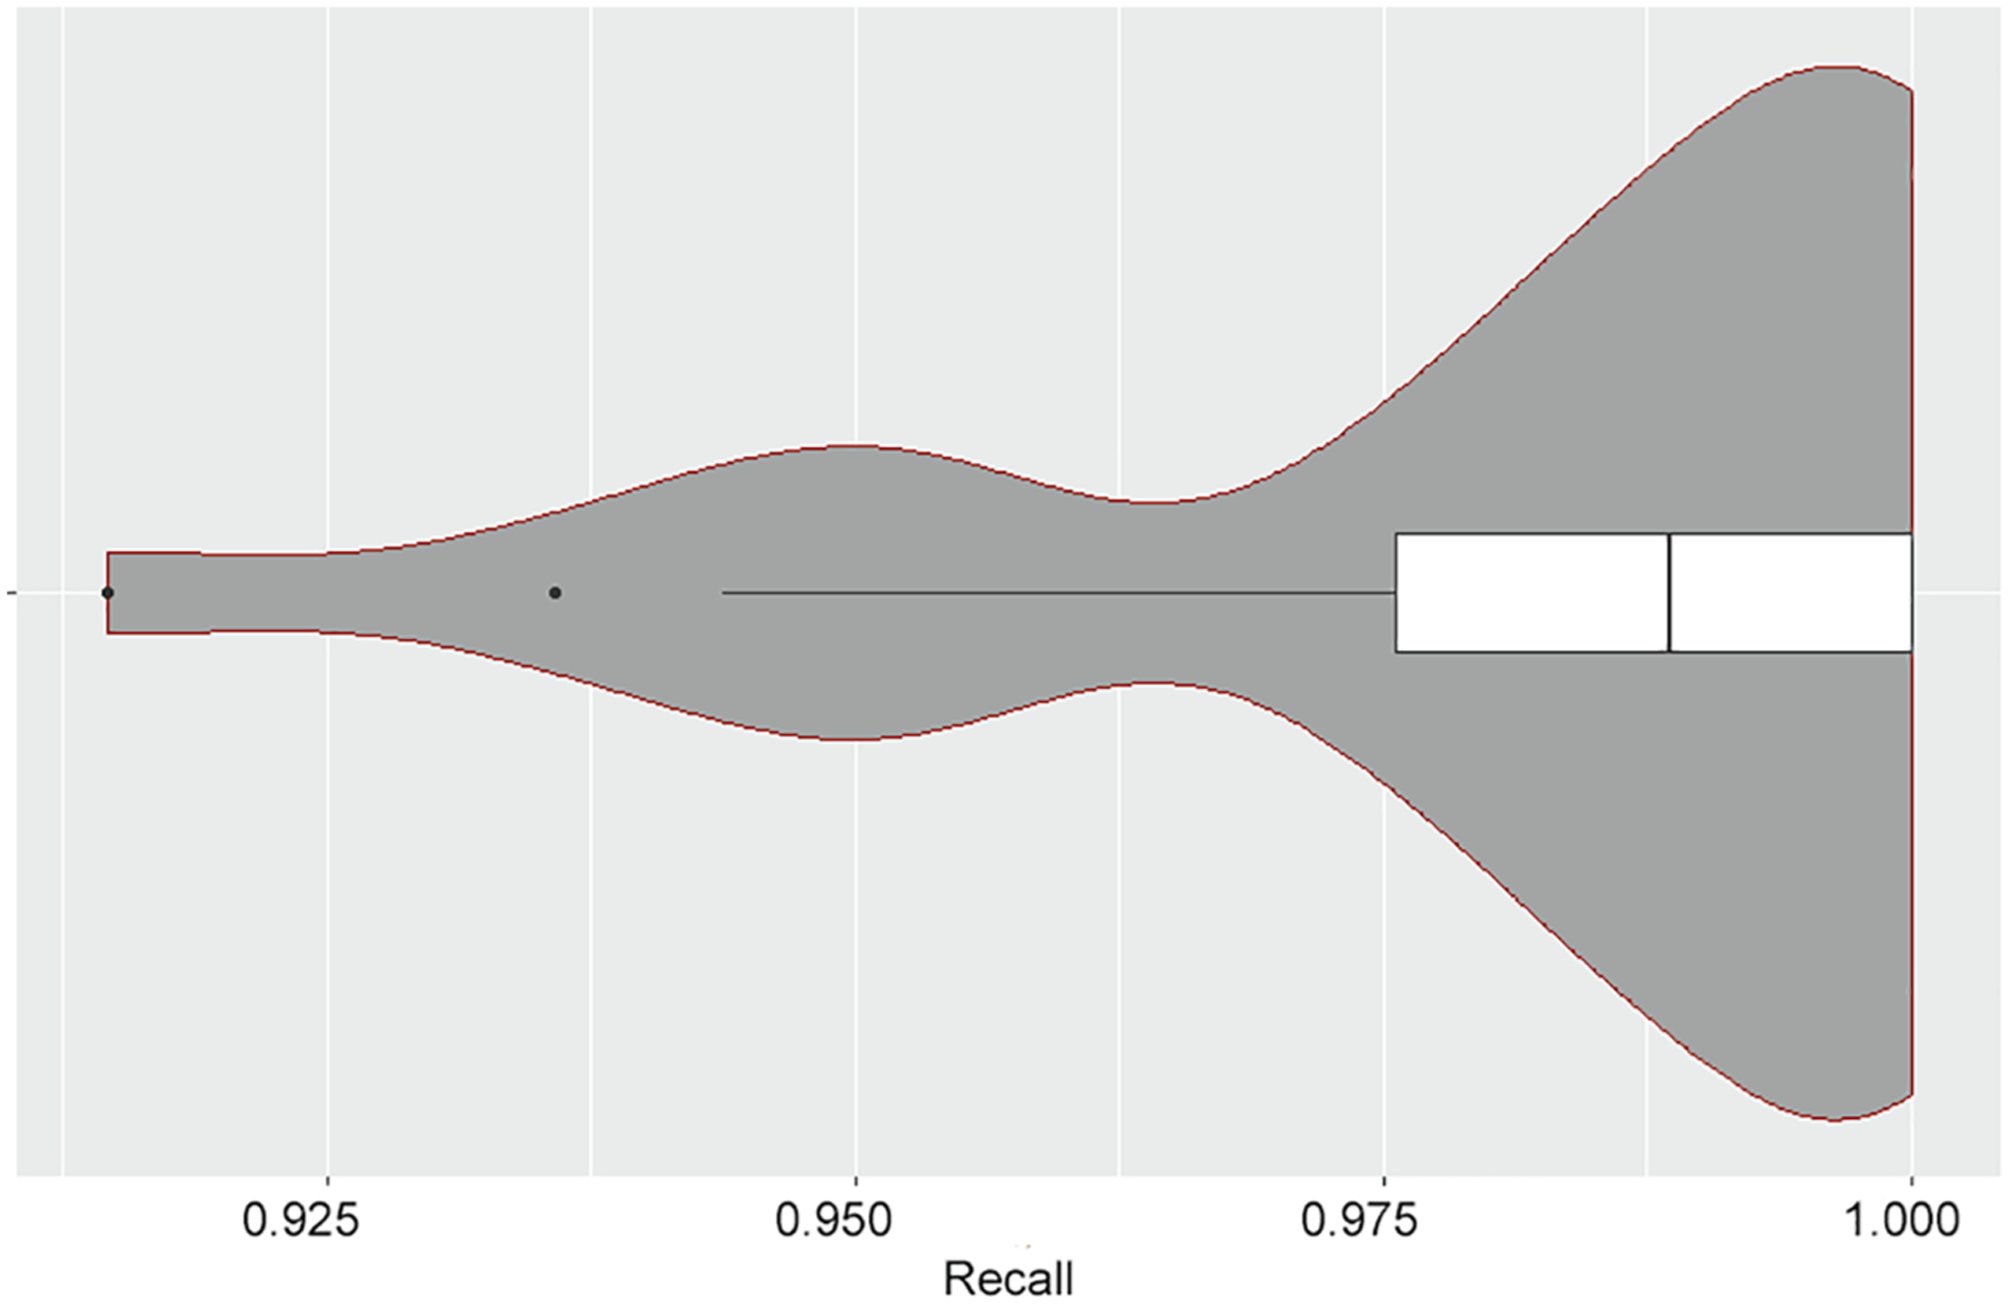
Violin plot of obtained true recall. The figure below shows the obtained recall for simulated screening of the 26 datasets, given estimated equal to 95%. The median obtained recall is 99%, indicating that the recall estimate tends to be conservative. In fact, the majority of the obtained true recall values (23/26) are above 95%. An outlier occurs at obtained recall equal to 91.5%.