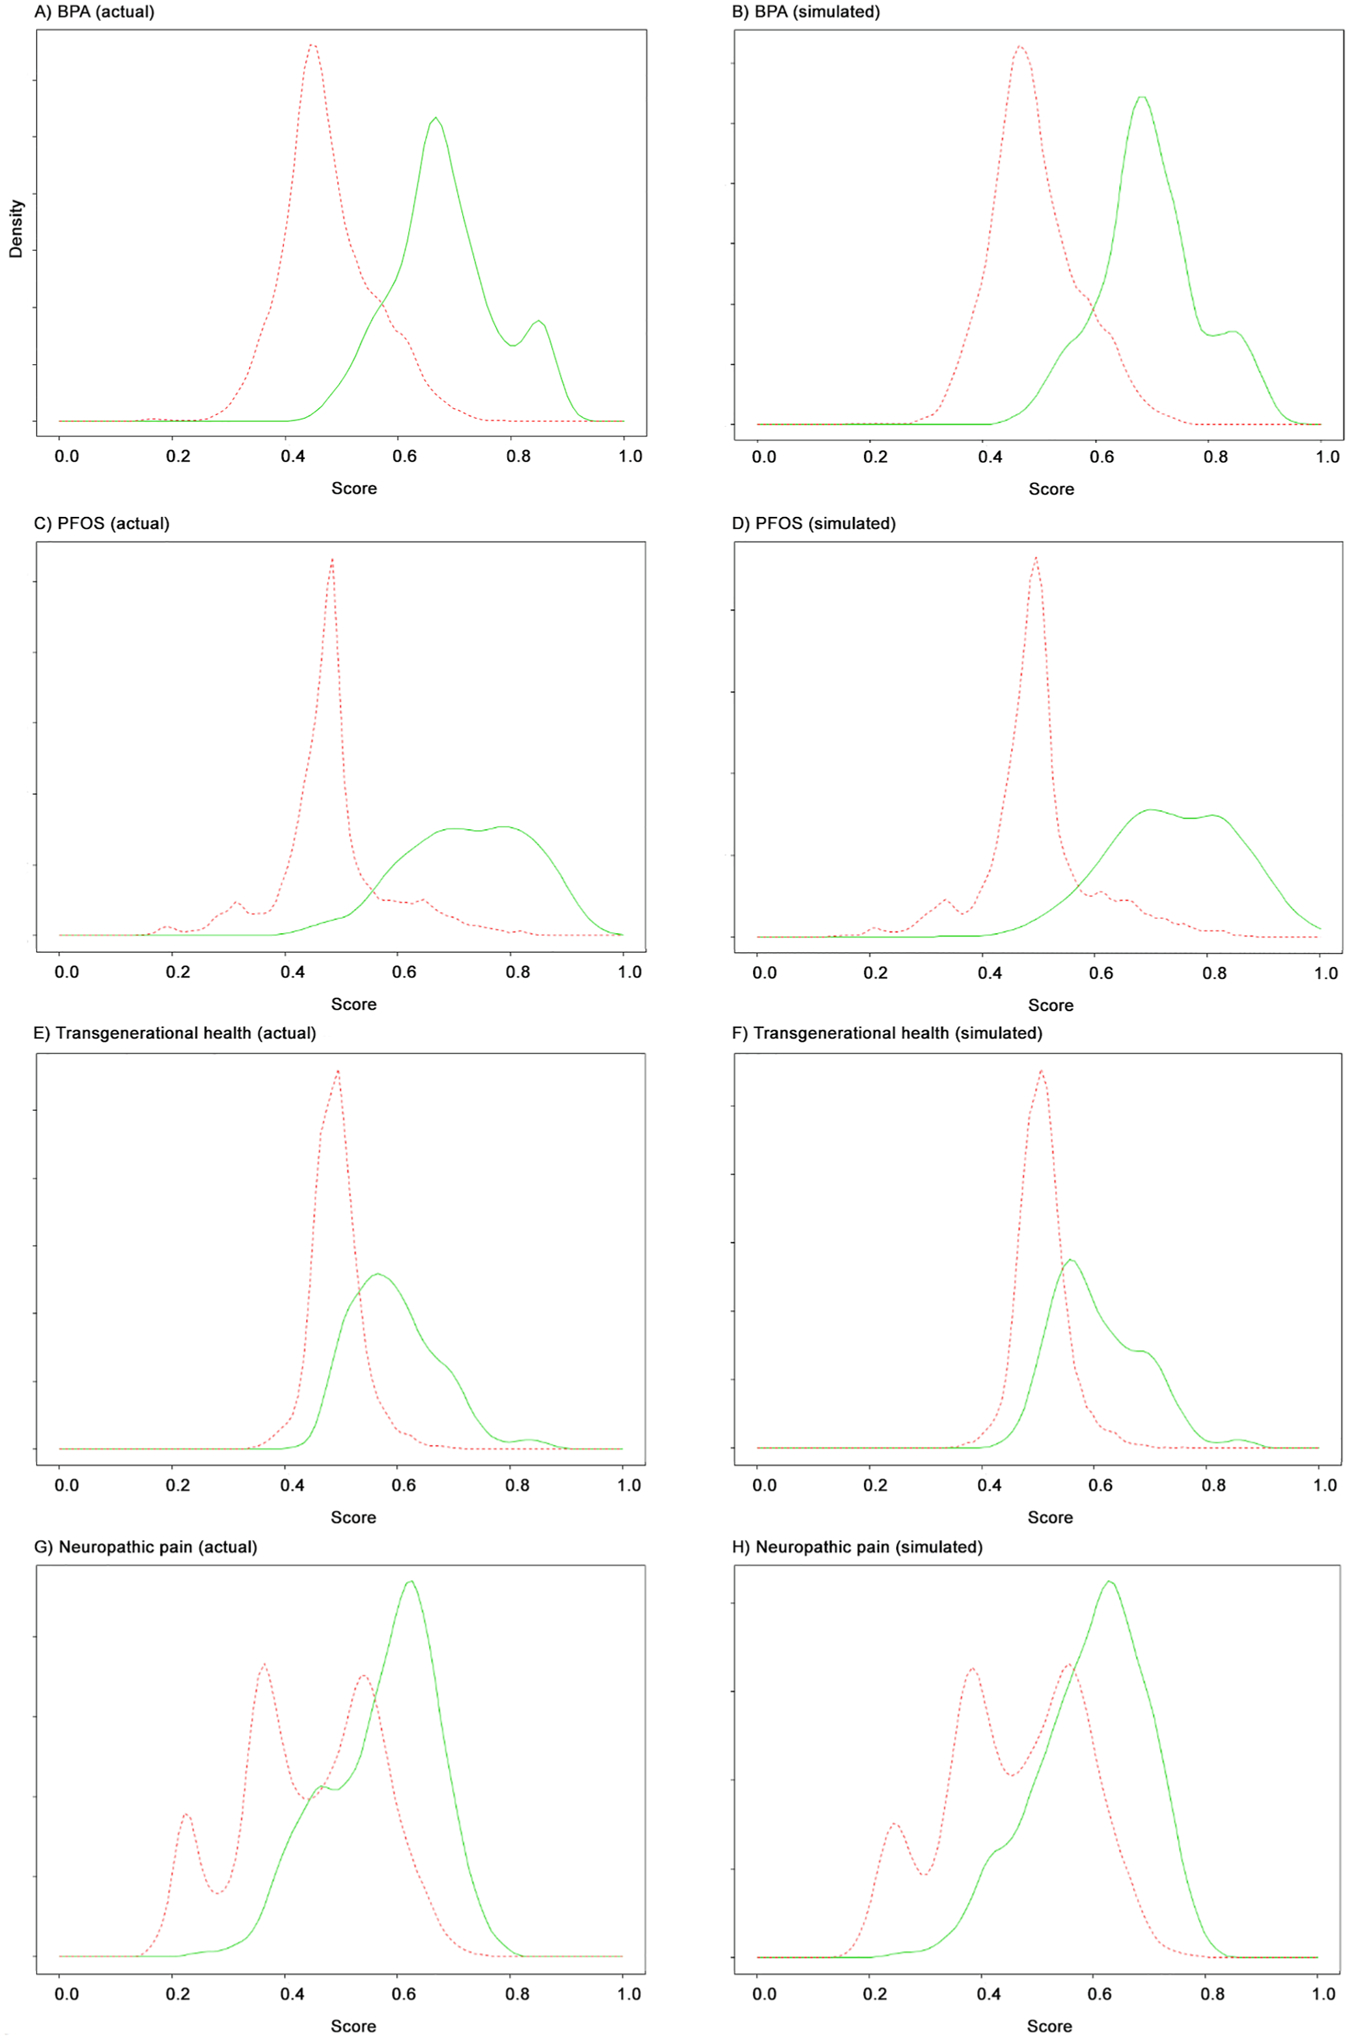
Fig. A4.

Actual and simulated score densities. Red line is for excluded documents; green is for included documents. All simulated data sets used overall inclusion rate of 0.05 and 10,000 total documents. Datasets shown are as follows: (a) BPA (actual); (b) BPA (simulated); (c) PFOS/PFOA (actual); (d) PFOS/PFOA (simulated); (e) Transgenerational health (actual); (f) Transgenerational health (simulated); (g) Neuropathic pain (actual); (h) Neuropathic pain (simulated). (For interpretation of the references to colour in this figure legend, the reader is referred to the web version of this article.)
