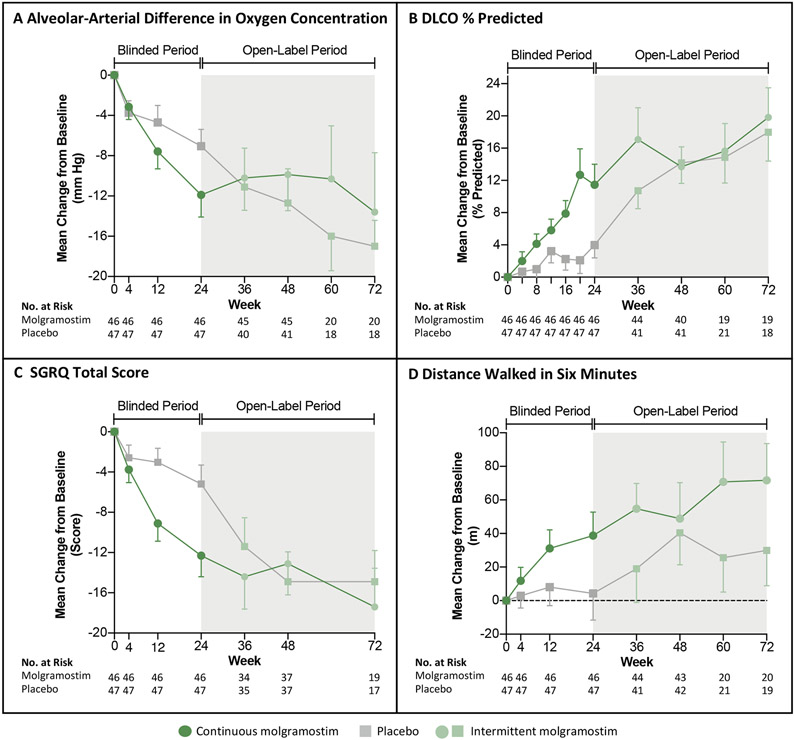
Figure 2. Changes in the Primary Endpoint and Selected Secondary Endpoints Over Time.
Panels A-D show the mean change from baseline during the blinded intervention period (white regions) and open-label treatment period (grey regions) for patients who received continuous molgramostim (n=46, green circles) or placebo (n=47, grey squares) from week 0 to week 24 and intermittent molgramostim from week 24 to week 72 for the following end points: alveolar-arterial difference in oxygen concentration (A-aDO2) (Panel A), diffusing capacity for carbon monoxide (DLCO percent of predicted) (Panel B), Saint George Respiratory Questionnaire (SGRQ) Total Score (Panel C), and distance covered in a six-minute walk test (6MWT) (Panel D). The number of patients for whom results were available at each time point is shown; data missing during the double-blind period were replaced using multiple imputation. The difference in numbers of patients included between weeks 24 – 48 and weeks 48 – 72 was due to a protocol amendment permitting use of a longer open-label period for some patients. T bars indicate standard errors.

