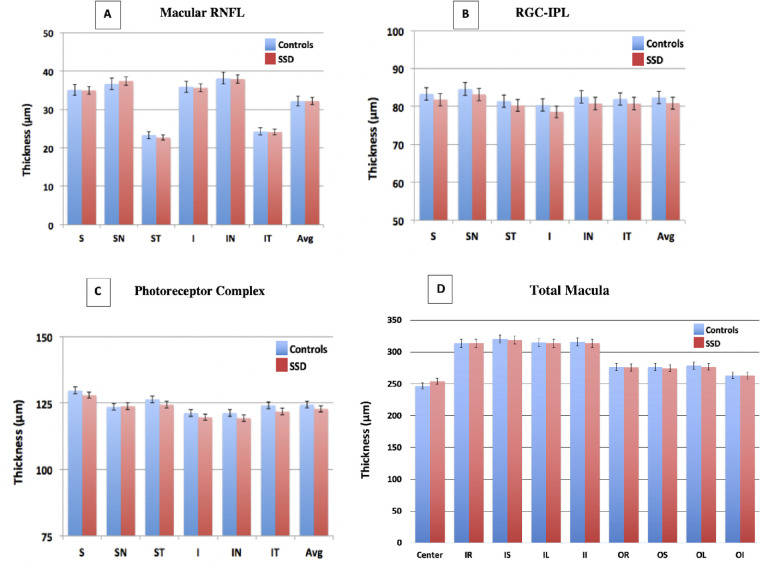
Figure 2.
Depicts spectral domain-optical coherence tomography comparison of (A) macular retinal nerve fiber layer, (B) ganglion cell-inner plexiform layer (GC-IPL), (C) outer retinal photoreceptor complex, and (D) total macular thicknesses between schizophrenia spectrum disorder (SSD) patients and controls. S, superior; SN, superior-nasal; ST, superior-temporal; I, inferior; IN, inferior-nasal; IT, inferior-temporal; Avg, average; IR, inner-right; IS, inner-superior; IL, inner-left; II, inner-inferior; OR, outer-right; OS, outer-superior; OL, outer-left; OI, outer-inferior of the Early Treatment Diabetic Retinopathy Study grid. Error bars: standard deviation.

