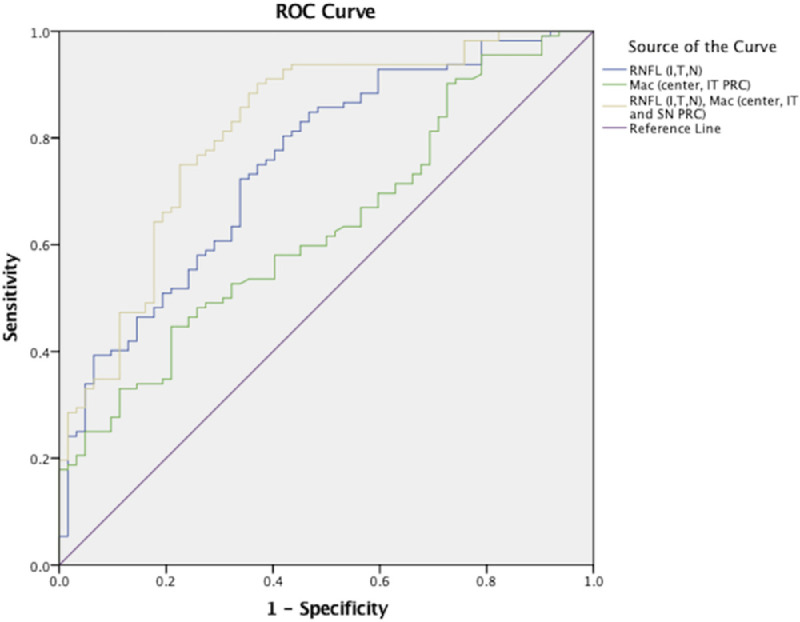
Figure 3.

Representation of receiver operator curves (ROCs) of three regression analyses to demonstrate which parameters of optical coherence tomography predict schizophrenia spectrum disorder group classification. The area under the curve (AUC) of the peripapillary retina (inferior, temporal, and nasal retinal nerve fiber layer [RNFL]) was 0.76 (blue curve). The AUC of the macula (center, inferior-temporal, and superior-nasal photoreceptor complex) was 0.63 (green curve). The AUC of the peripapillary retina (inferior, temporal, and nasal RNFL) and macula (center, inferior-temporal, and superior-nasal photoreceptor complex) was 0.82 (gold curve).
