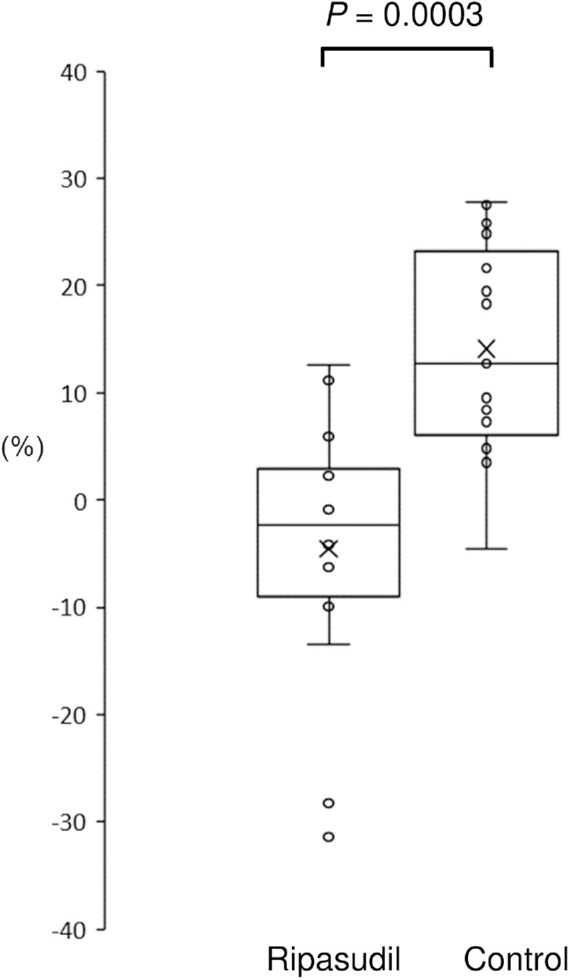
Figure 3.

ECD loss after surgery in the ripasudil and the control groups. ECD could be measured for a subset of the cohort (patients without BK). ECD loss is presented as follows: (ECD before surgery − ECD after surgery)/ECD before surgery × 100%. The horizontal lines in the box and whisker plots represent the median values, and the bottom and top of the boxes represent the lower and upper quartiles, respectively. The x represents the mean, and the bars represent the minimum and maximum values within 1.5 times the lower and upper quartiles. ECD, Endothelial cell density.
