
Figure 4.
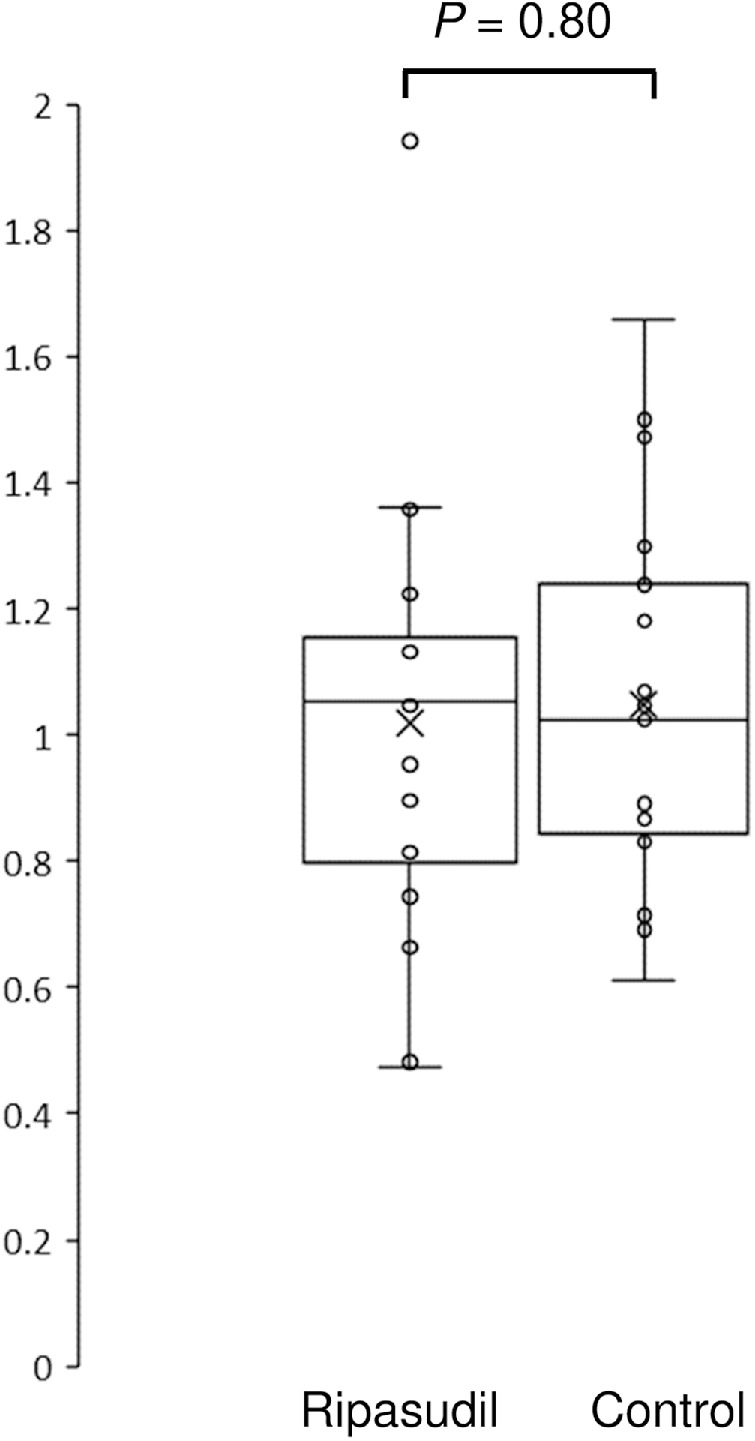
Changes in the IOP after surgery in the ripasudil and the control groups. The IOP value one week after surgery divided by the IOP value before surgery is presented. The horizontal lines in the box and whisker plots represent the median values, and the bottom and top of the boxes represent the lower and upper quartiles, respectively. The x represents the mean and the bars represent the minimum and maximum values within 1.5 times the lower and upper quartiles. IOP, Intraocular pressure.