Figure 8.
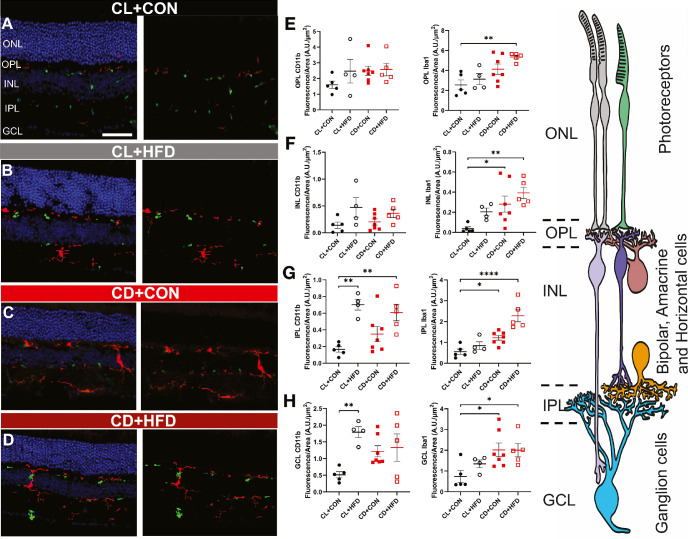
Both CD and HFD cause increased retinal immune activation, as measured by CD11b (green) and Iba1 (red). Representative retinal immunofluorescence microscopy results, with (left) and without (right) DAPI staining (blue), showing retinal layers of the (A) CL + CON group, the (B) CL + HFD group, the (C) CD + CON group, and the (D) CD + HFD group show increased retinal expression of CD11b in CL + HFD, CD + CON, and CD + HFD groups and increased retinal expression of Iba1 in the CD + CON and CD + HFD groups. Measured fluorescence by retinal layer, showing no difference in (E) CD11b staining in the OPL (1-way ANOVA, F(3, 17) = 1.23, P = 0.33) but increased Iba1 staining in the OPL (1-way ANOVA, F(3, 17) = 6.25, P = 0.0047) in the CD + HFD group. (F) In the INL, there was also no difference in CD11b expression (1-way ANOVA, F(3, 17) = 2.52, P = 0.092), but Iba1 expression was increased (1-way ANOVA, F(3, 17) = 5.36, P = 0.022) in the CD + CON and CD + HFD groups. In the IPL, (G) CD11b increased (1-way ANOVA, F(3, 17) = 8.06, P = 0.0015) in both HFD groups while Iba1 increased (1-way ANOVA, F(3, 17) = 15.87, P < 0.0001) in both CD groups. Likewise, in the GCL, (H) CD11b was increased (1-way ANOVA, F(3, 17) = 4.34, P = 0.019) in the CL + HFD group and Iba1 was increased (1-way ANOVA, F(3, 17) = 3.89, P = 0.023) in both CD groups. (I) Drawing representing the retinal layers. Images from the CL + CON group (n = 5 mice), CL + HFD group (n = 4 mice), CD + CON group (n = 7 mice), and CD + HFD group (n = 5 mice) include both sexes. Data are presented as mean ± SEM and analyzed by 1-way ANOVAs with Dunnett tests. *P < 0.05, **P < 0.01, ***P < 0.001, and ****P < 0.0001 versus the CL + CON group. Scale bar = 12 µm.

